WEKO3
アイテム
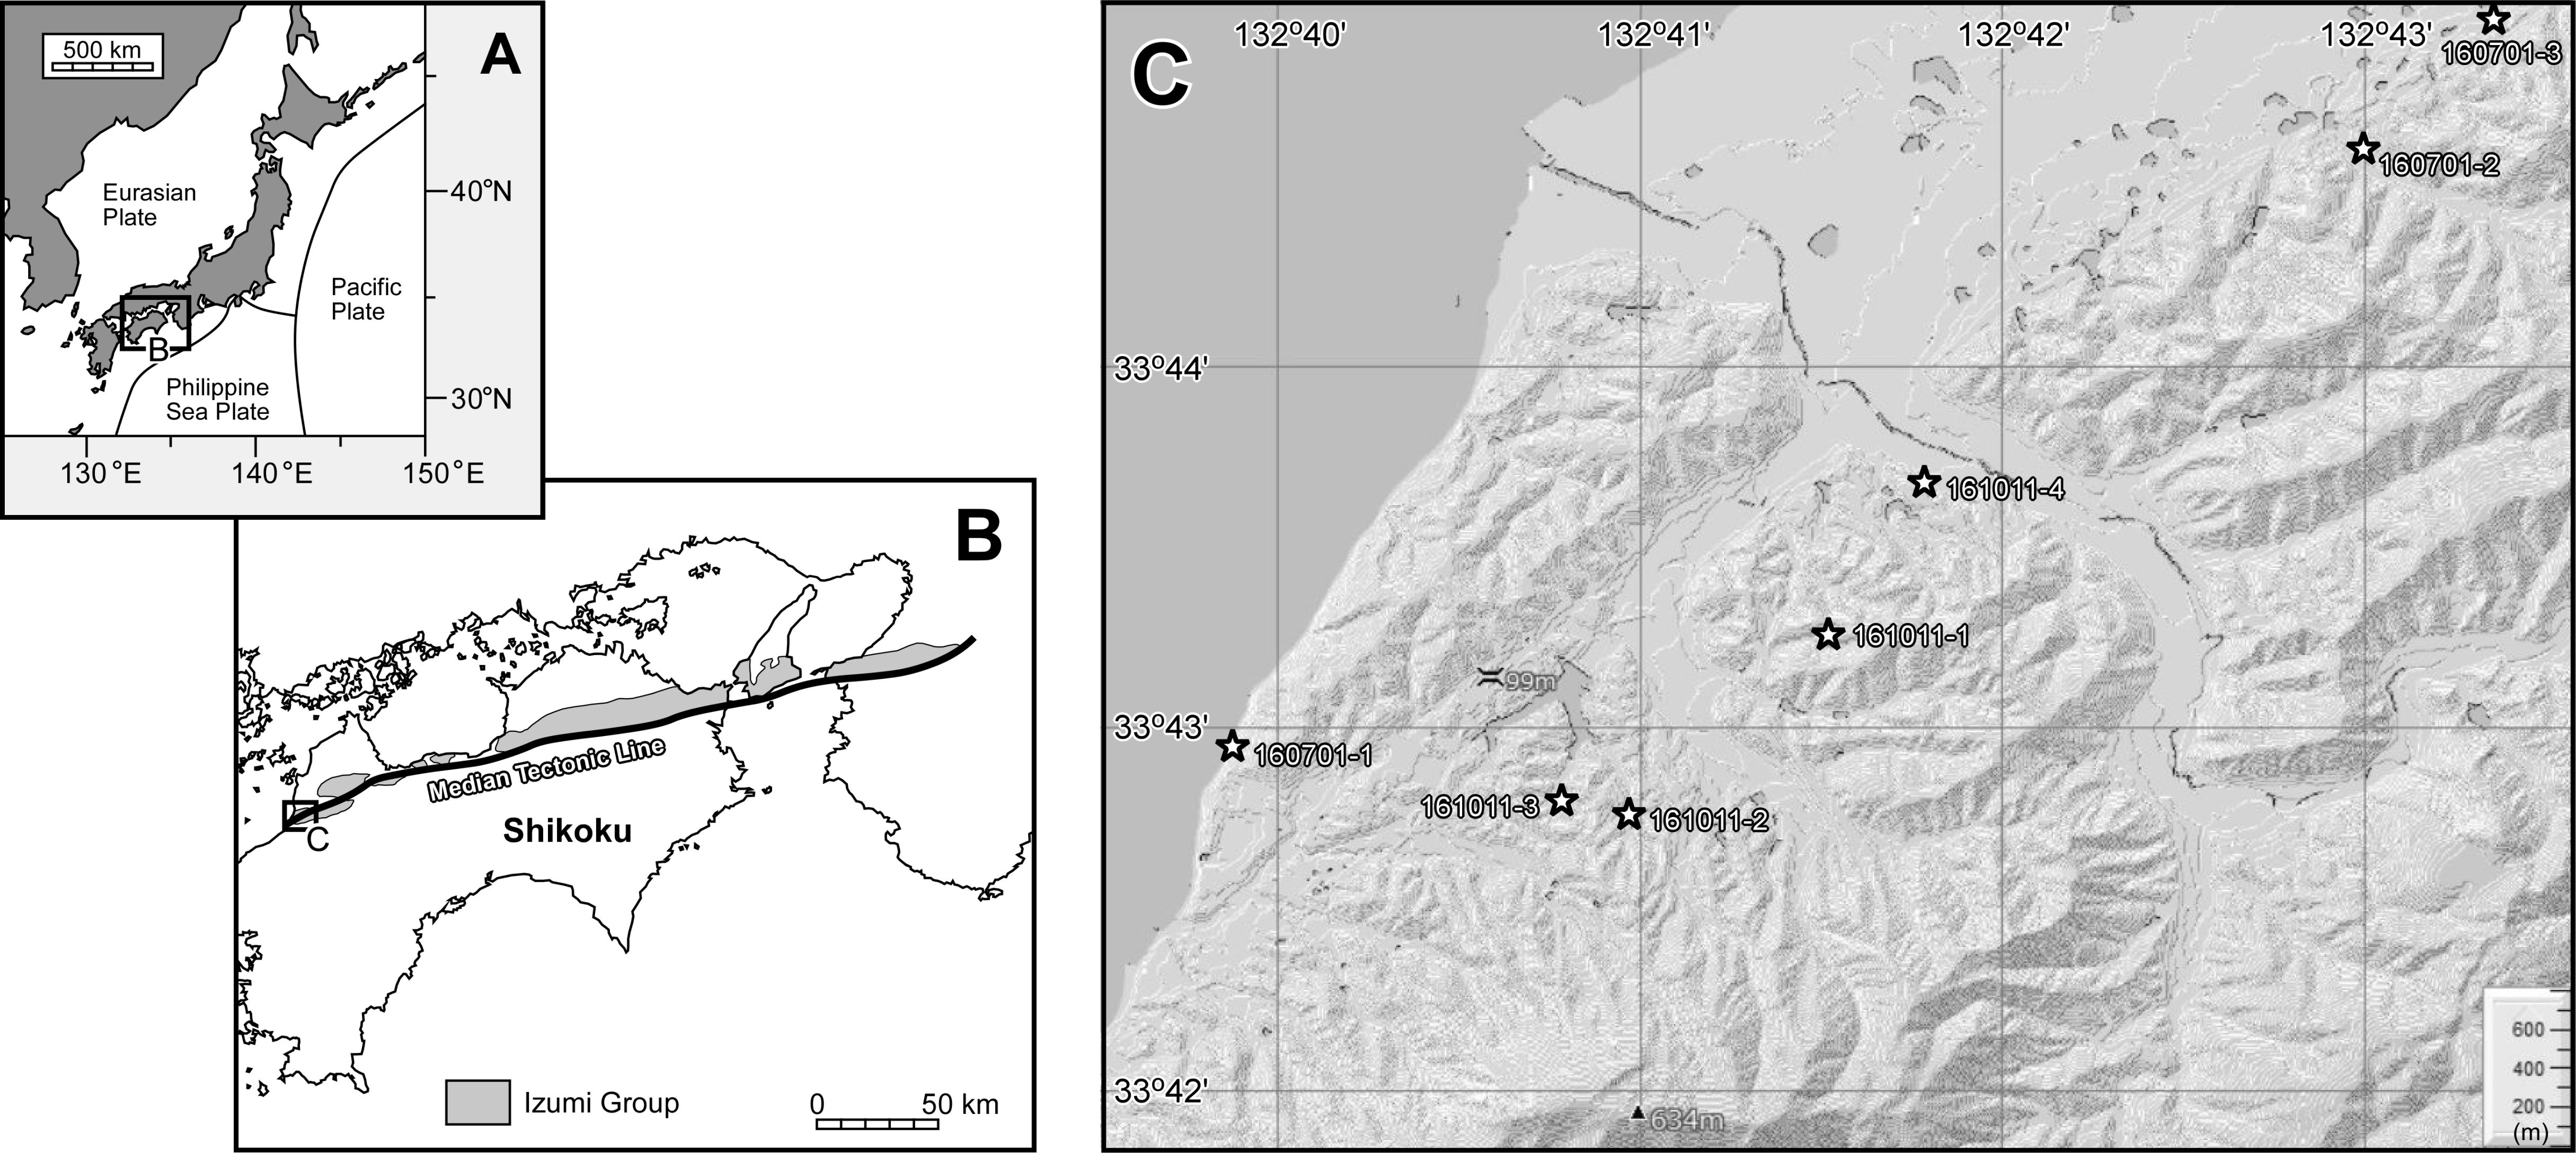
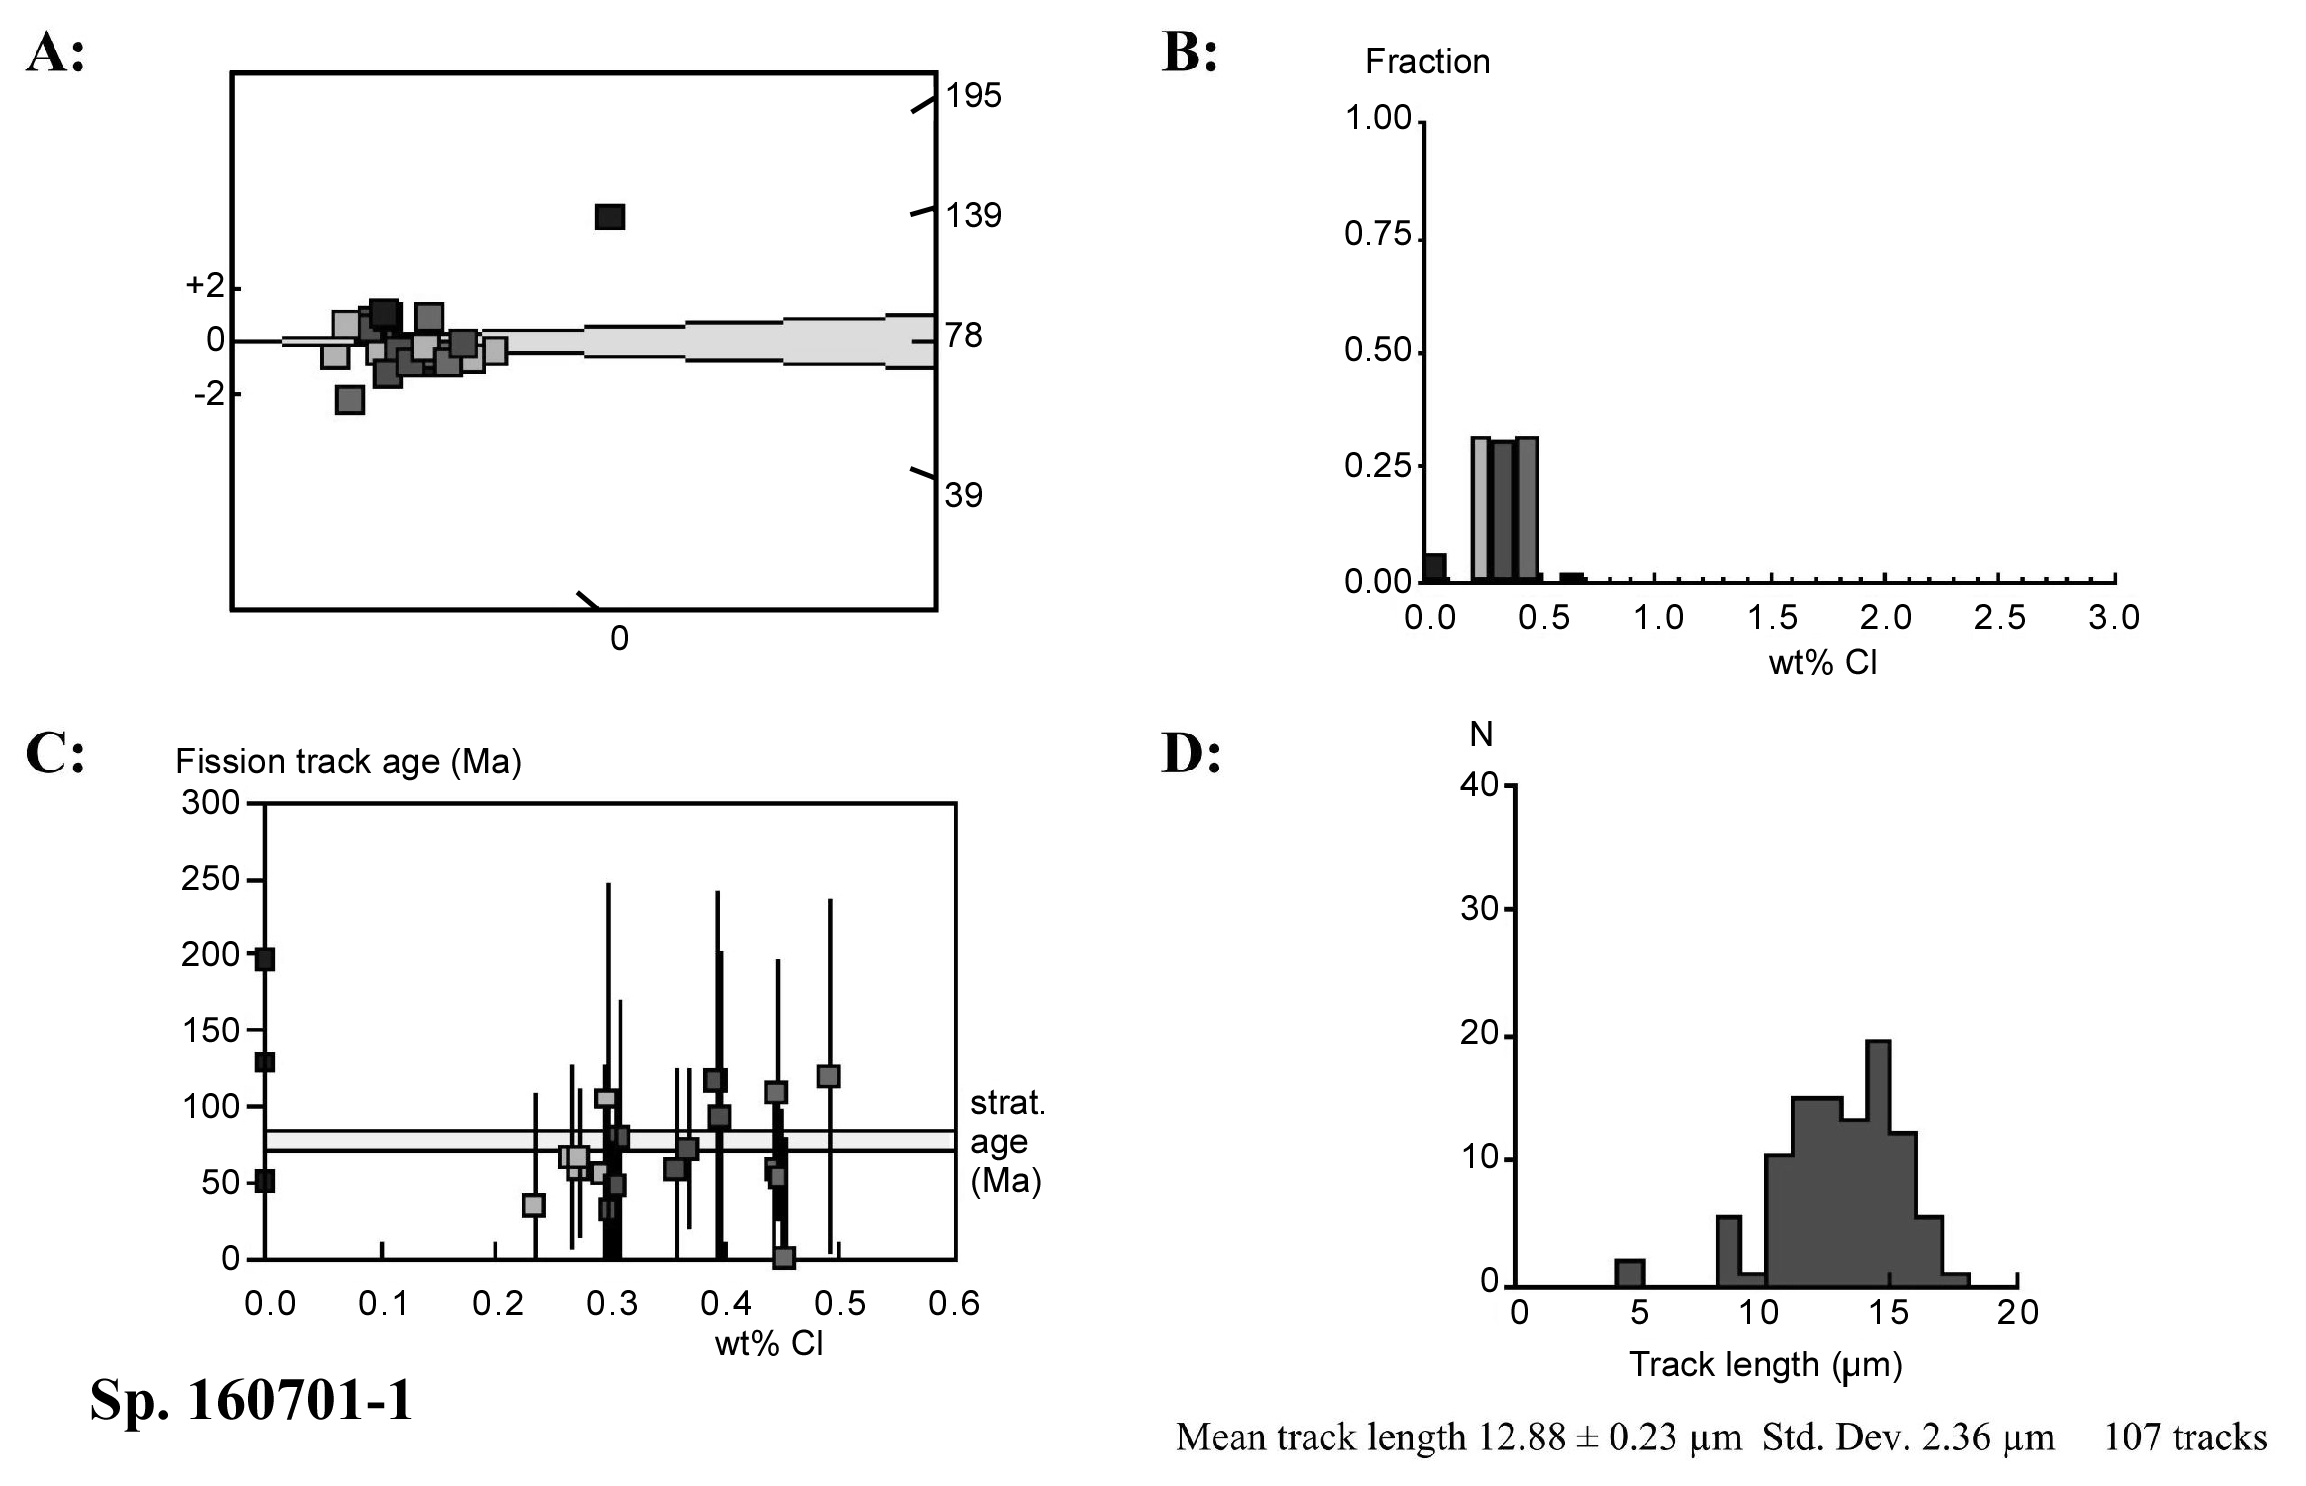
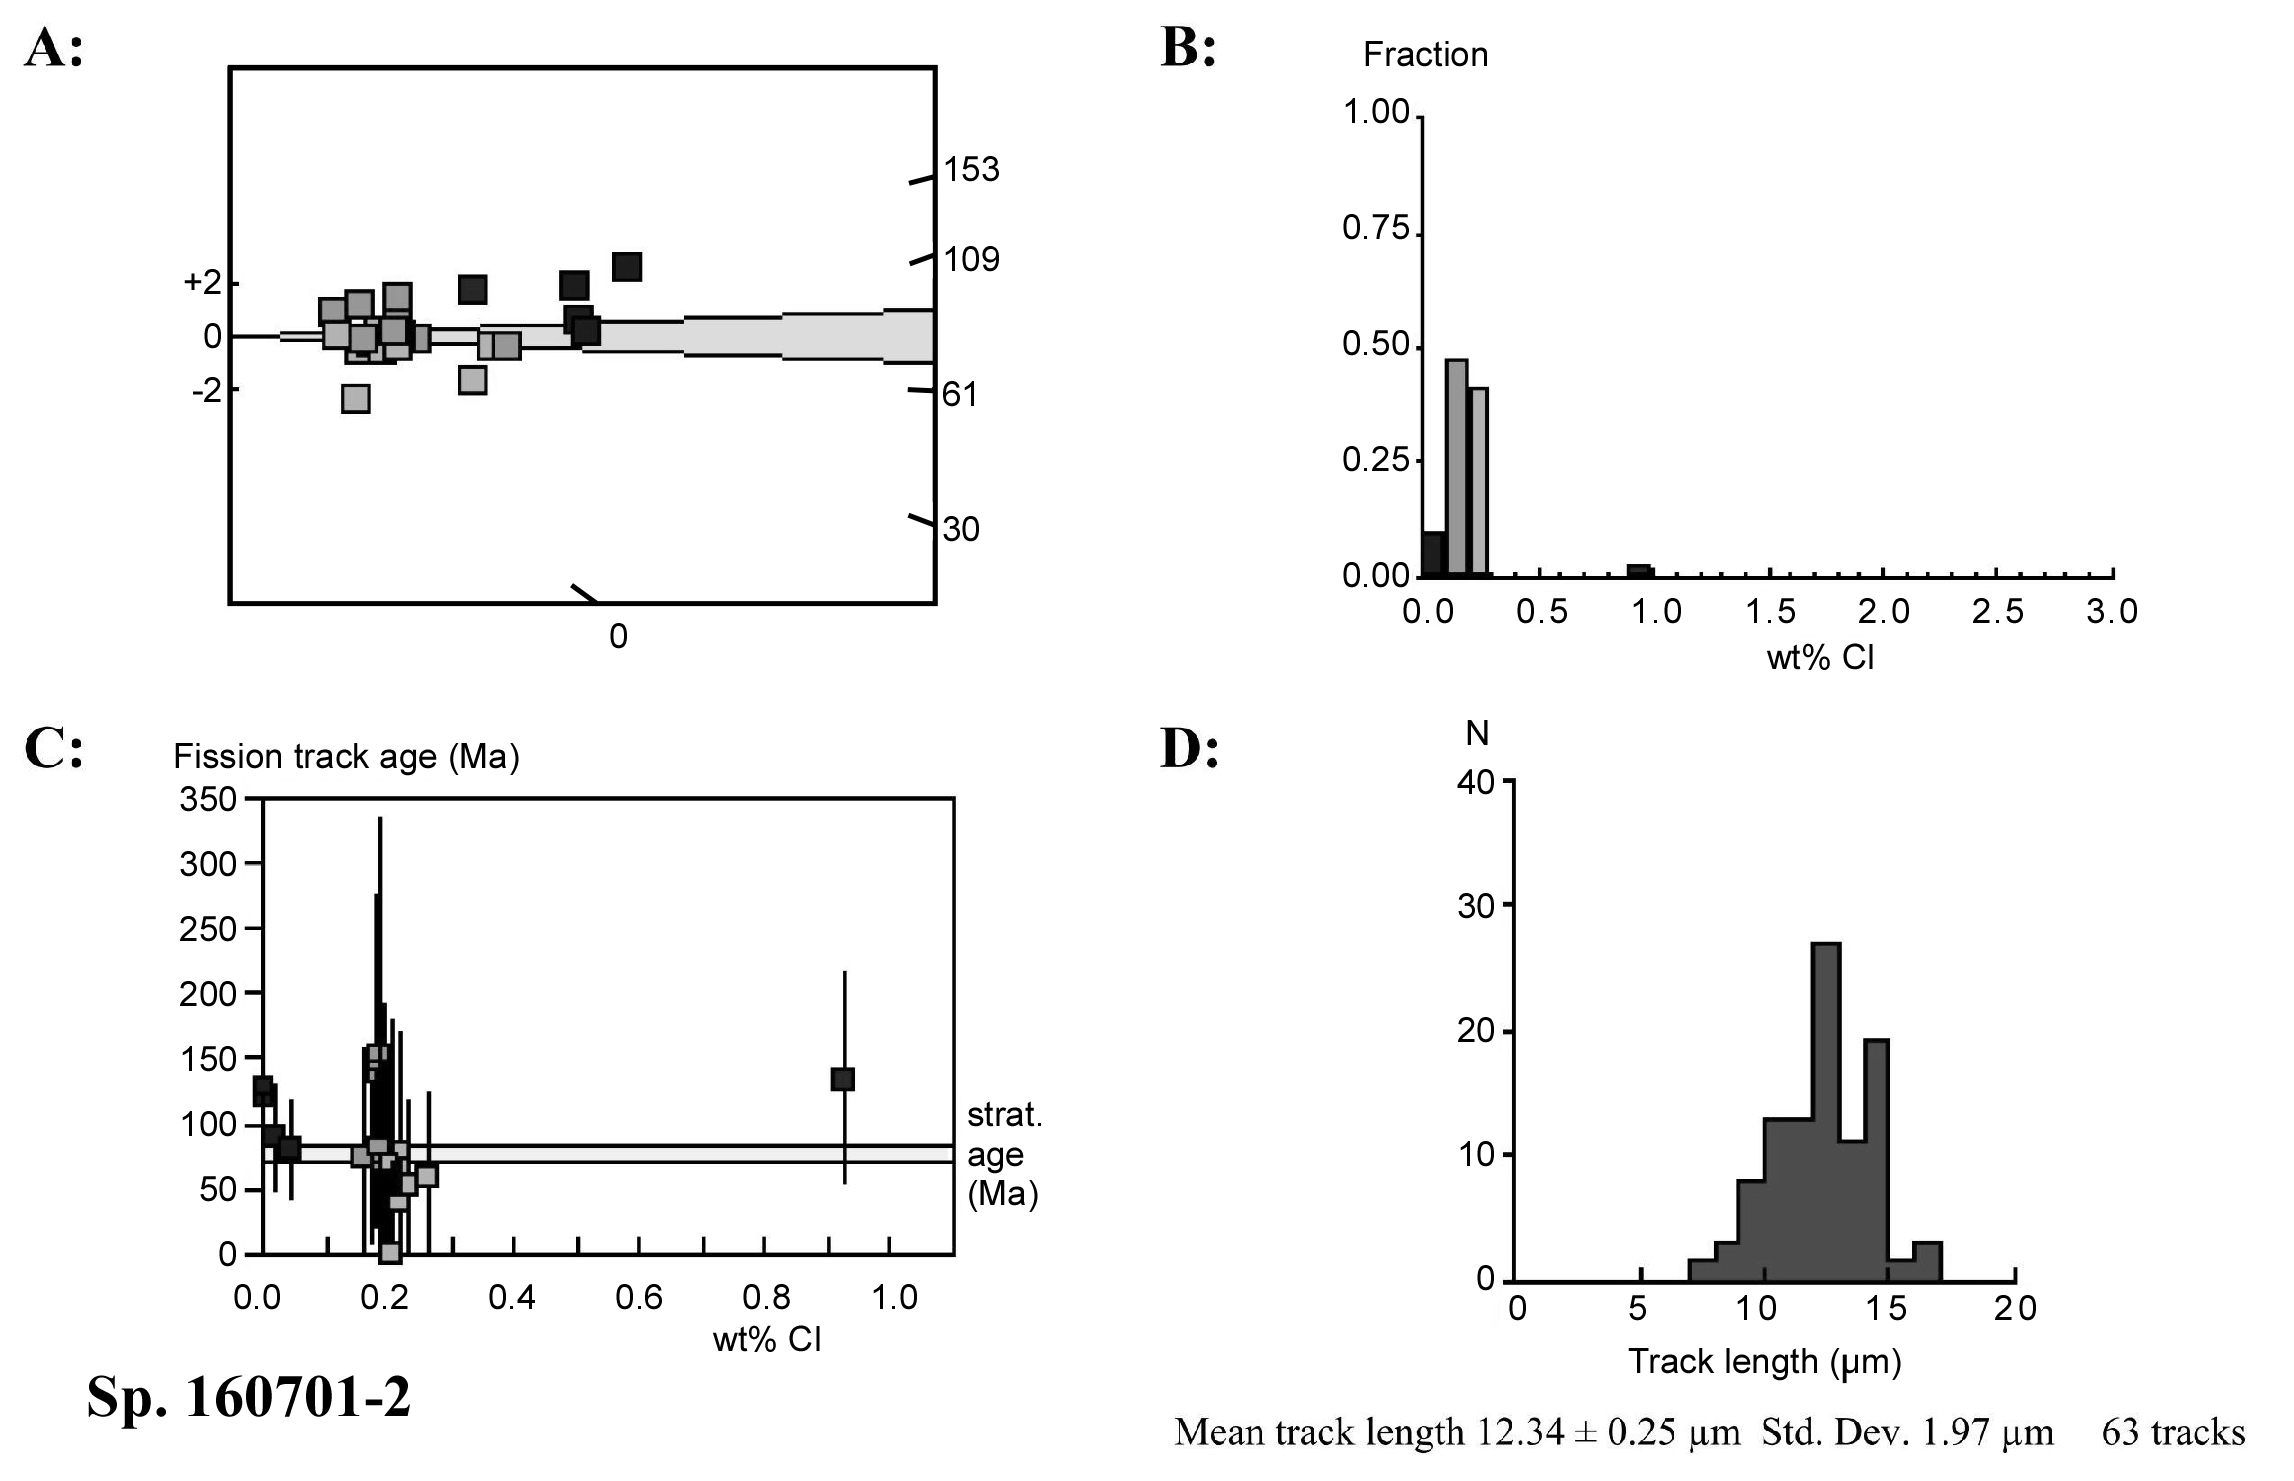
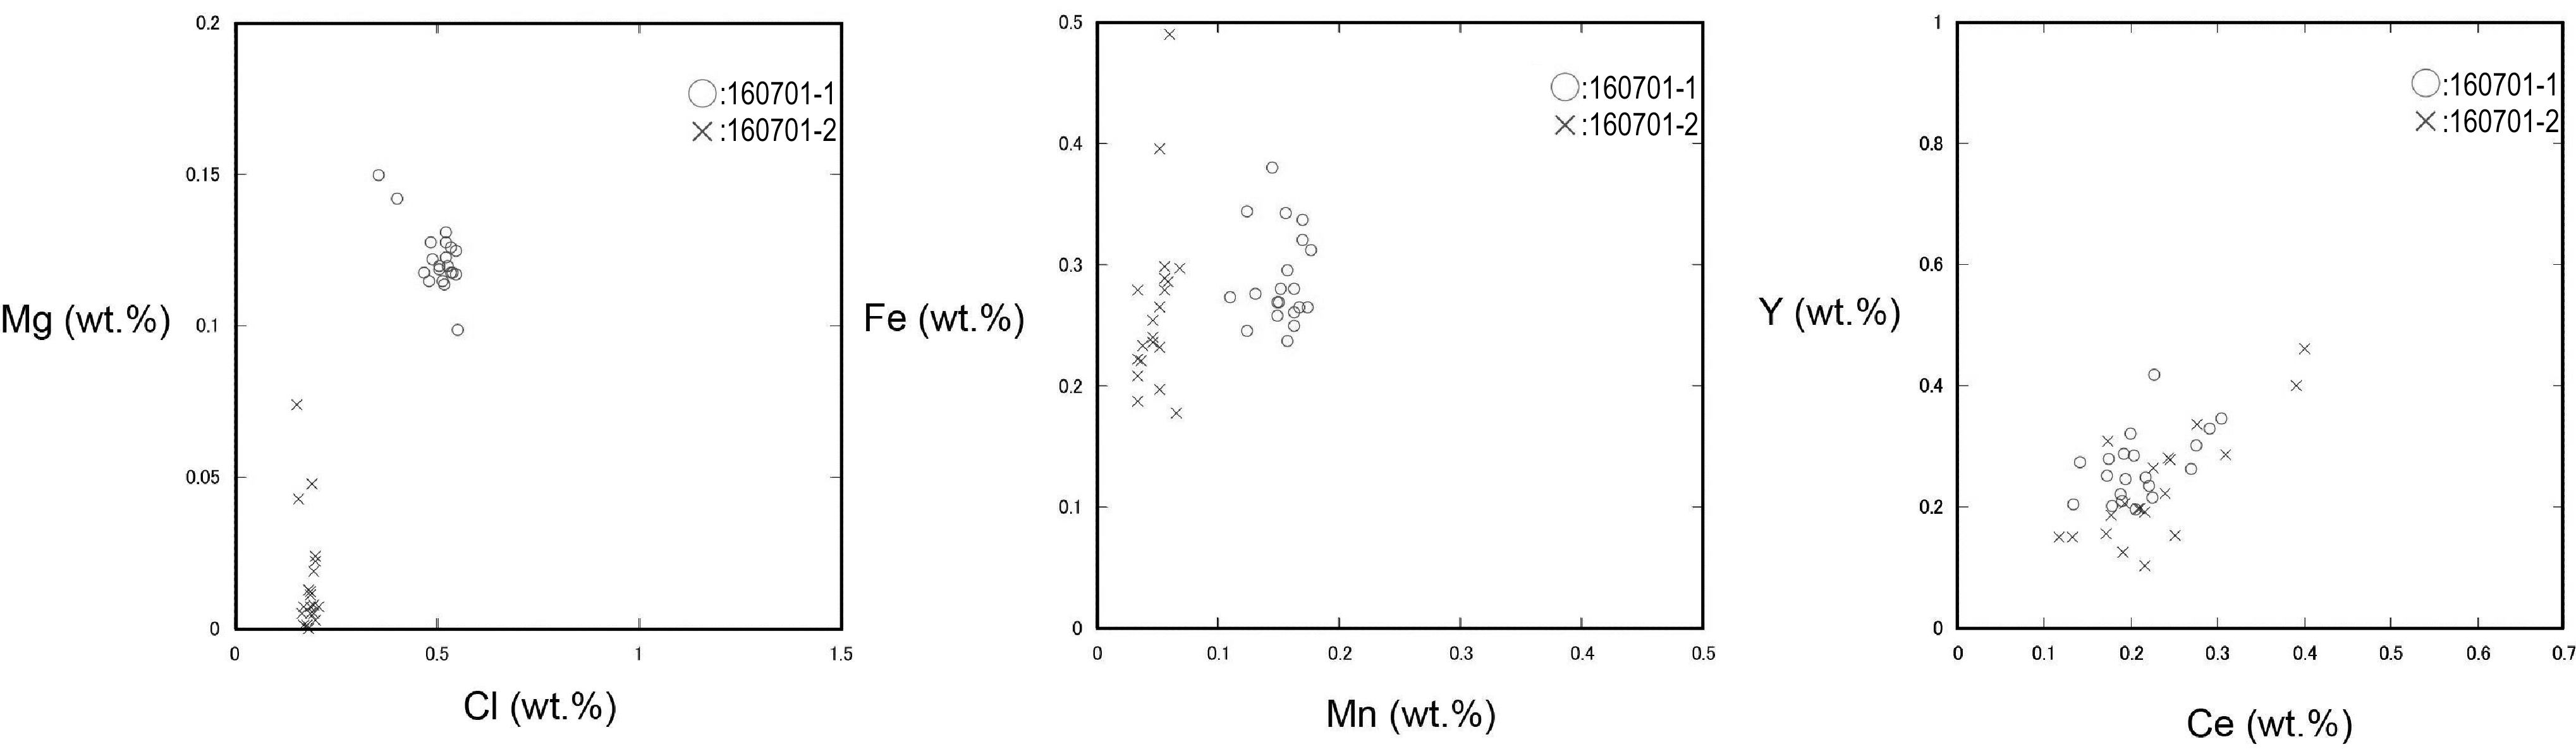
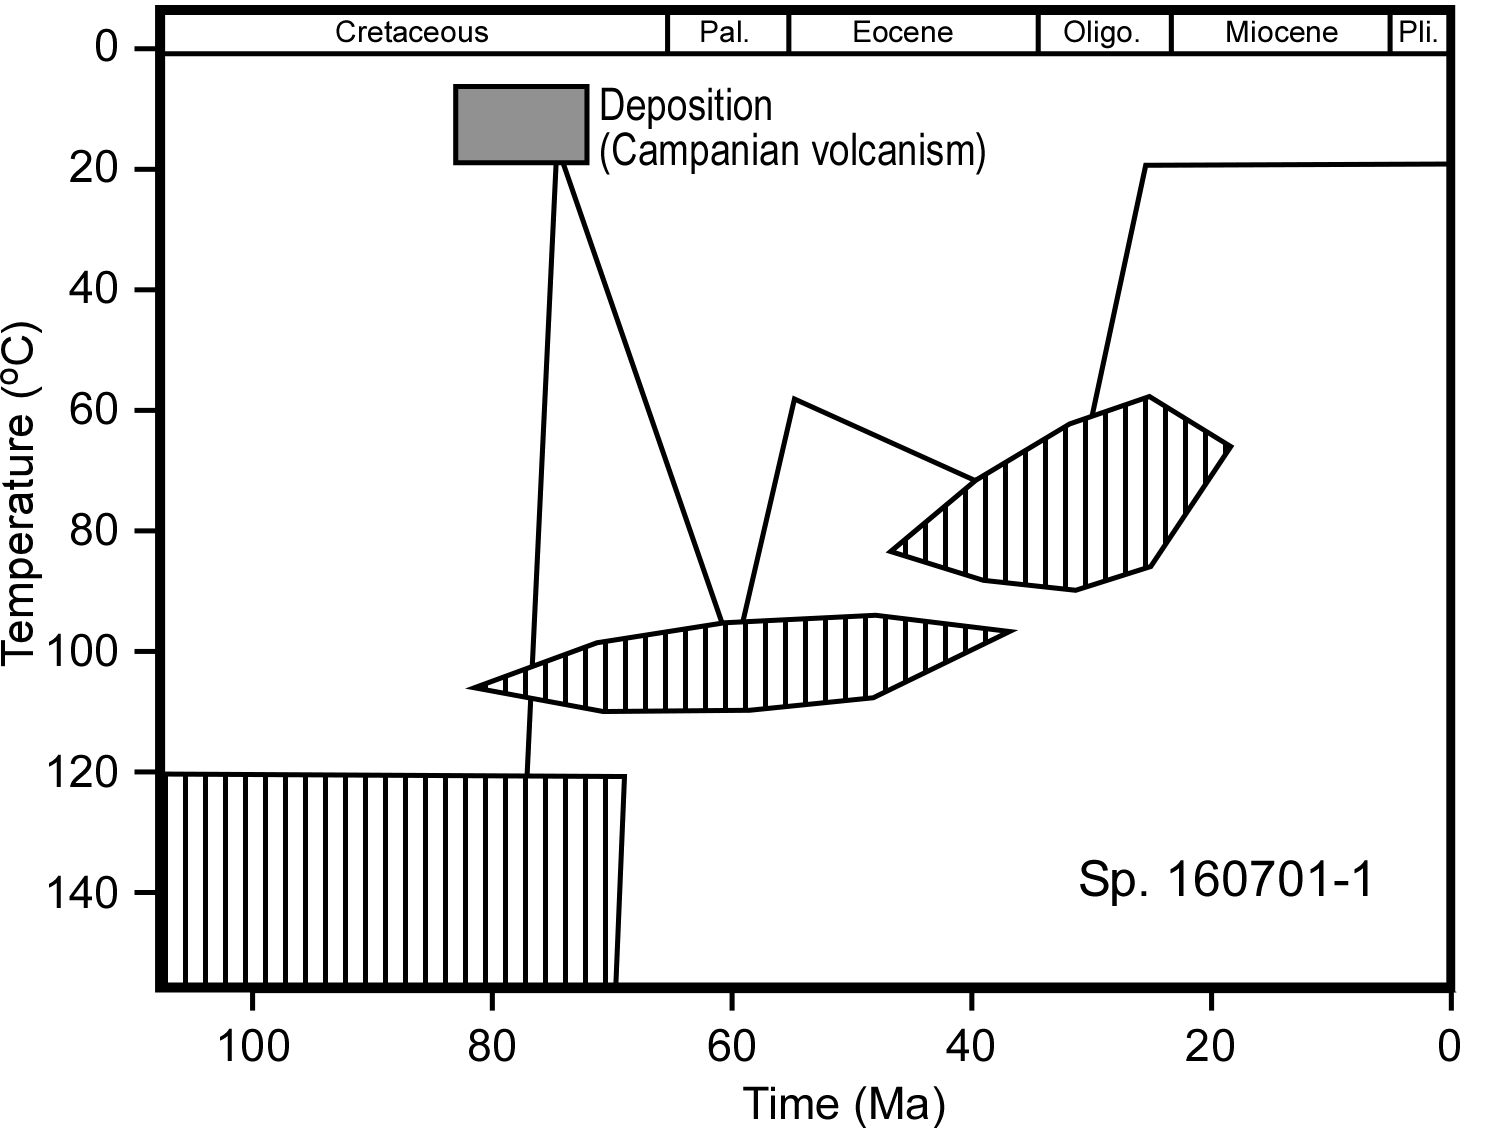
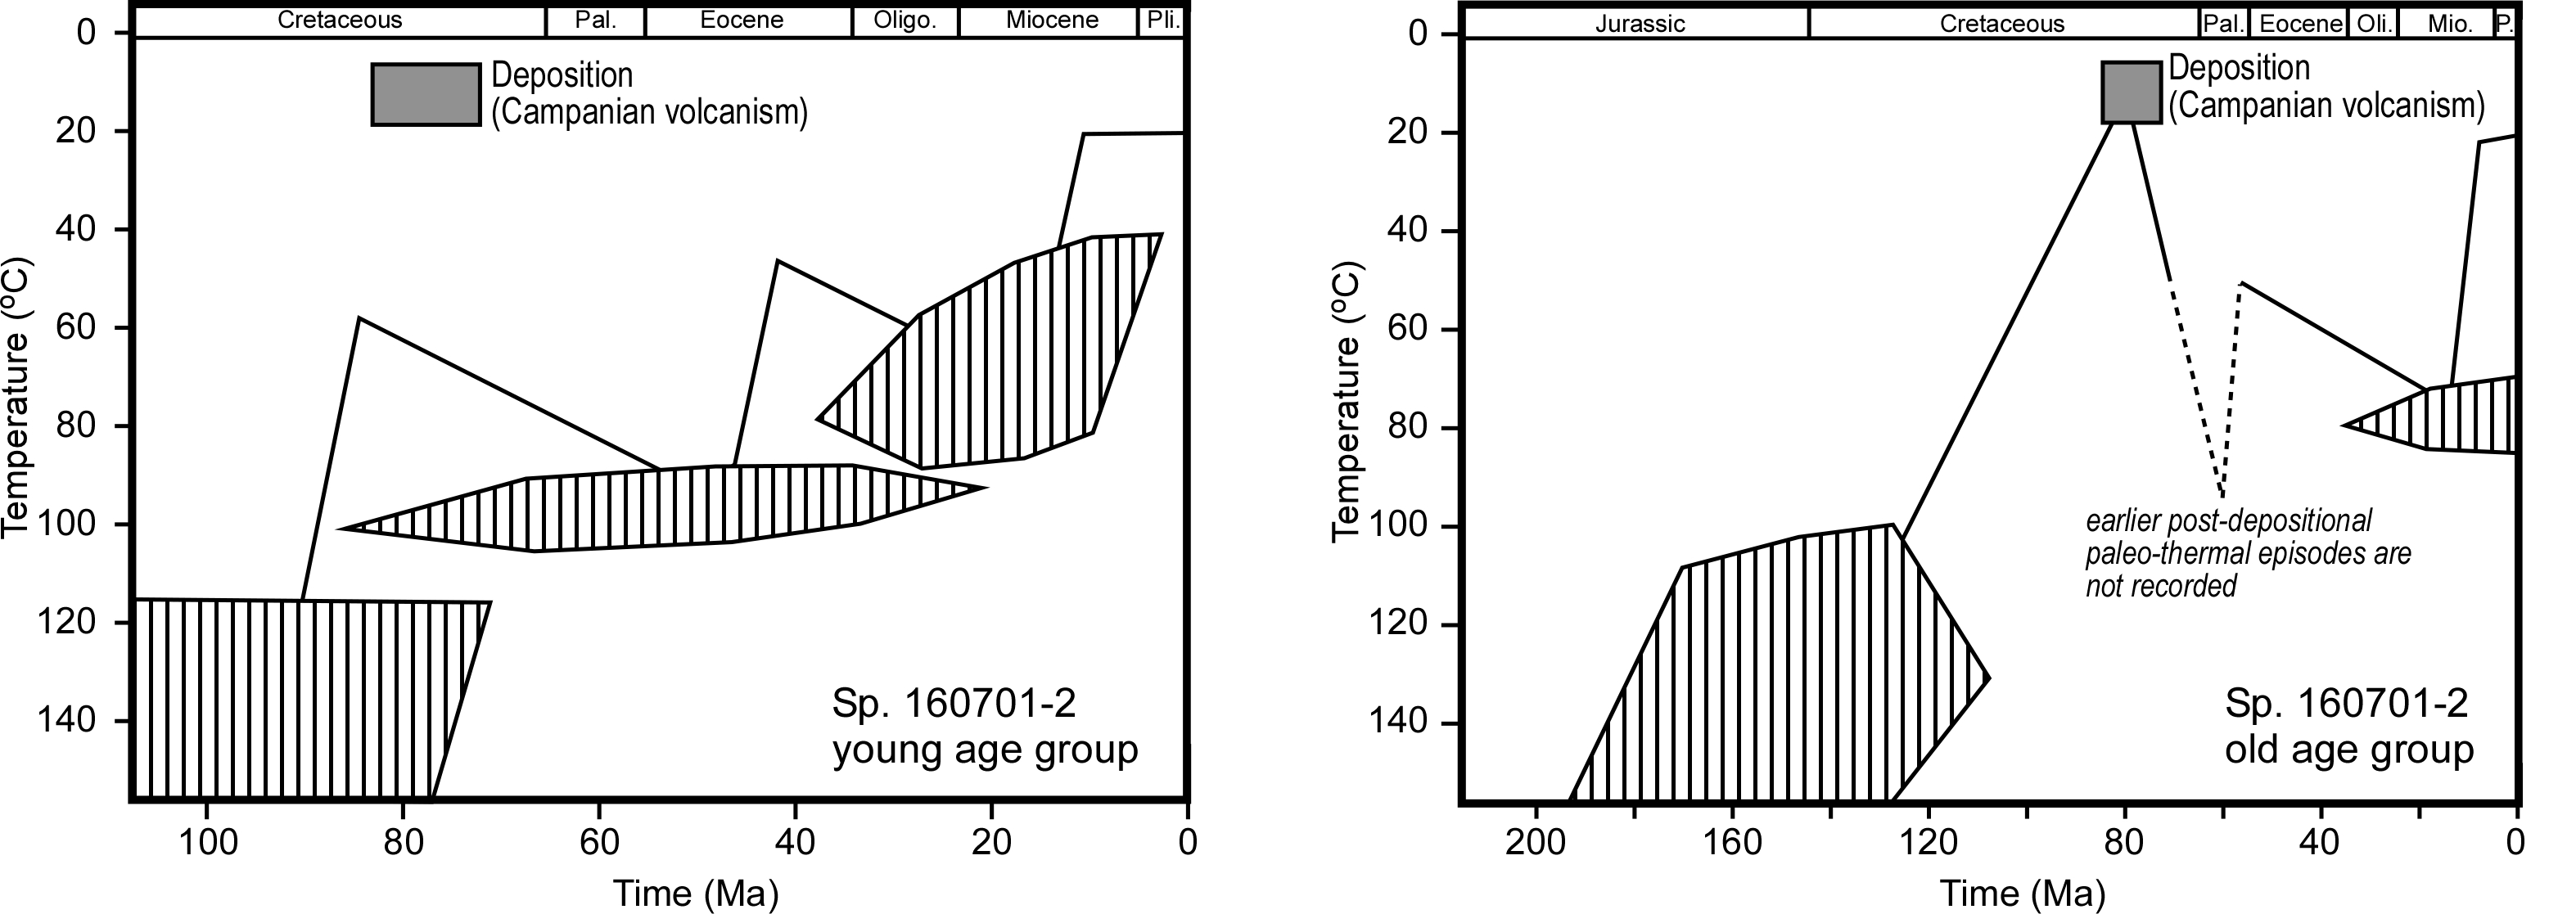
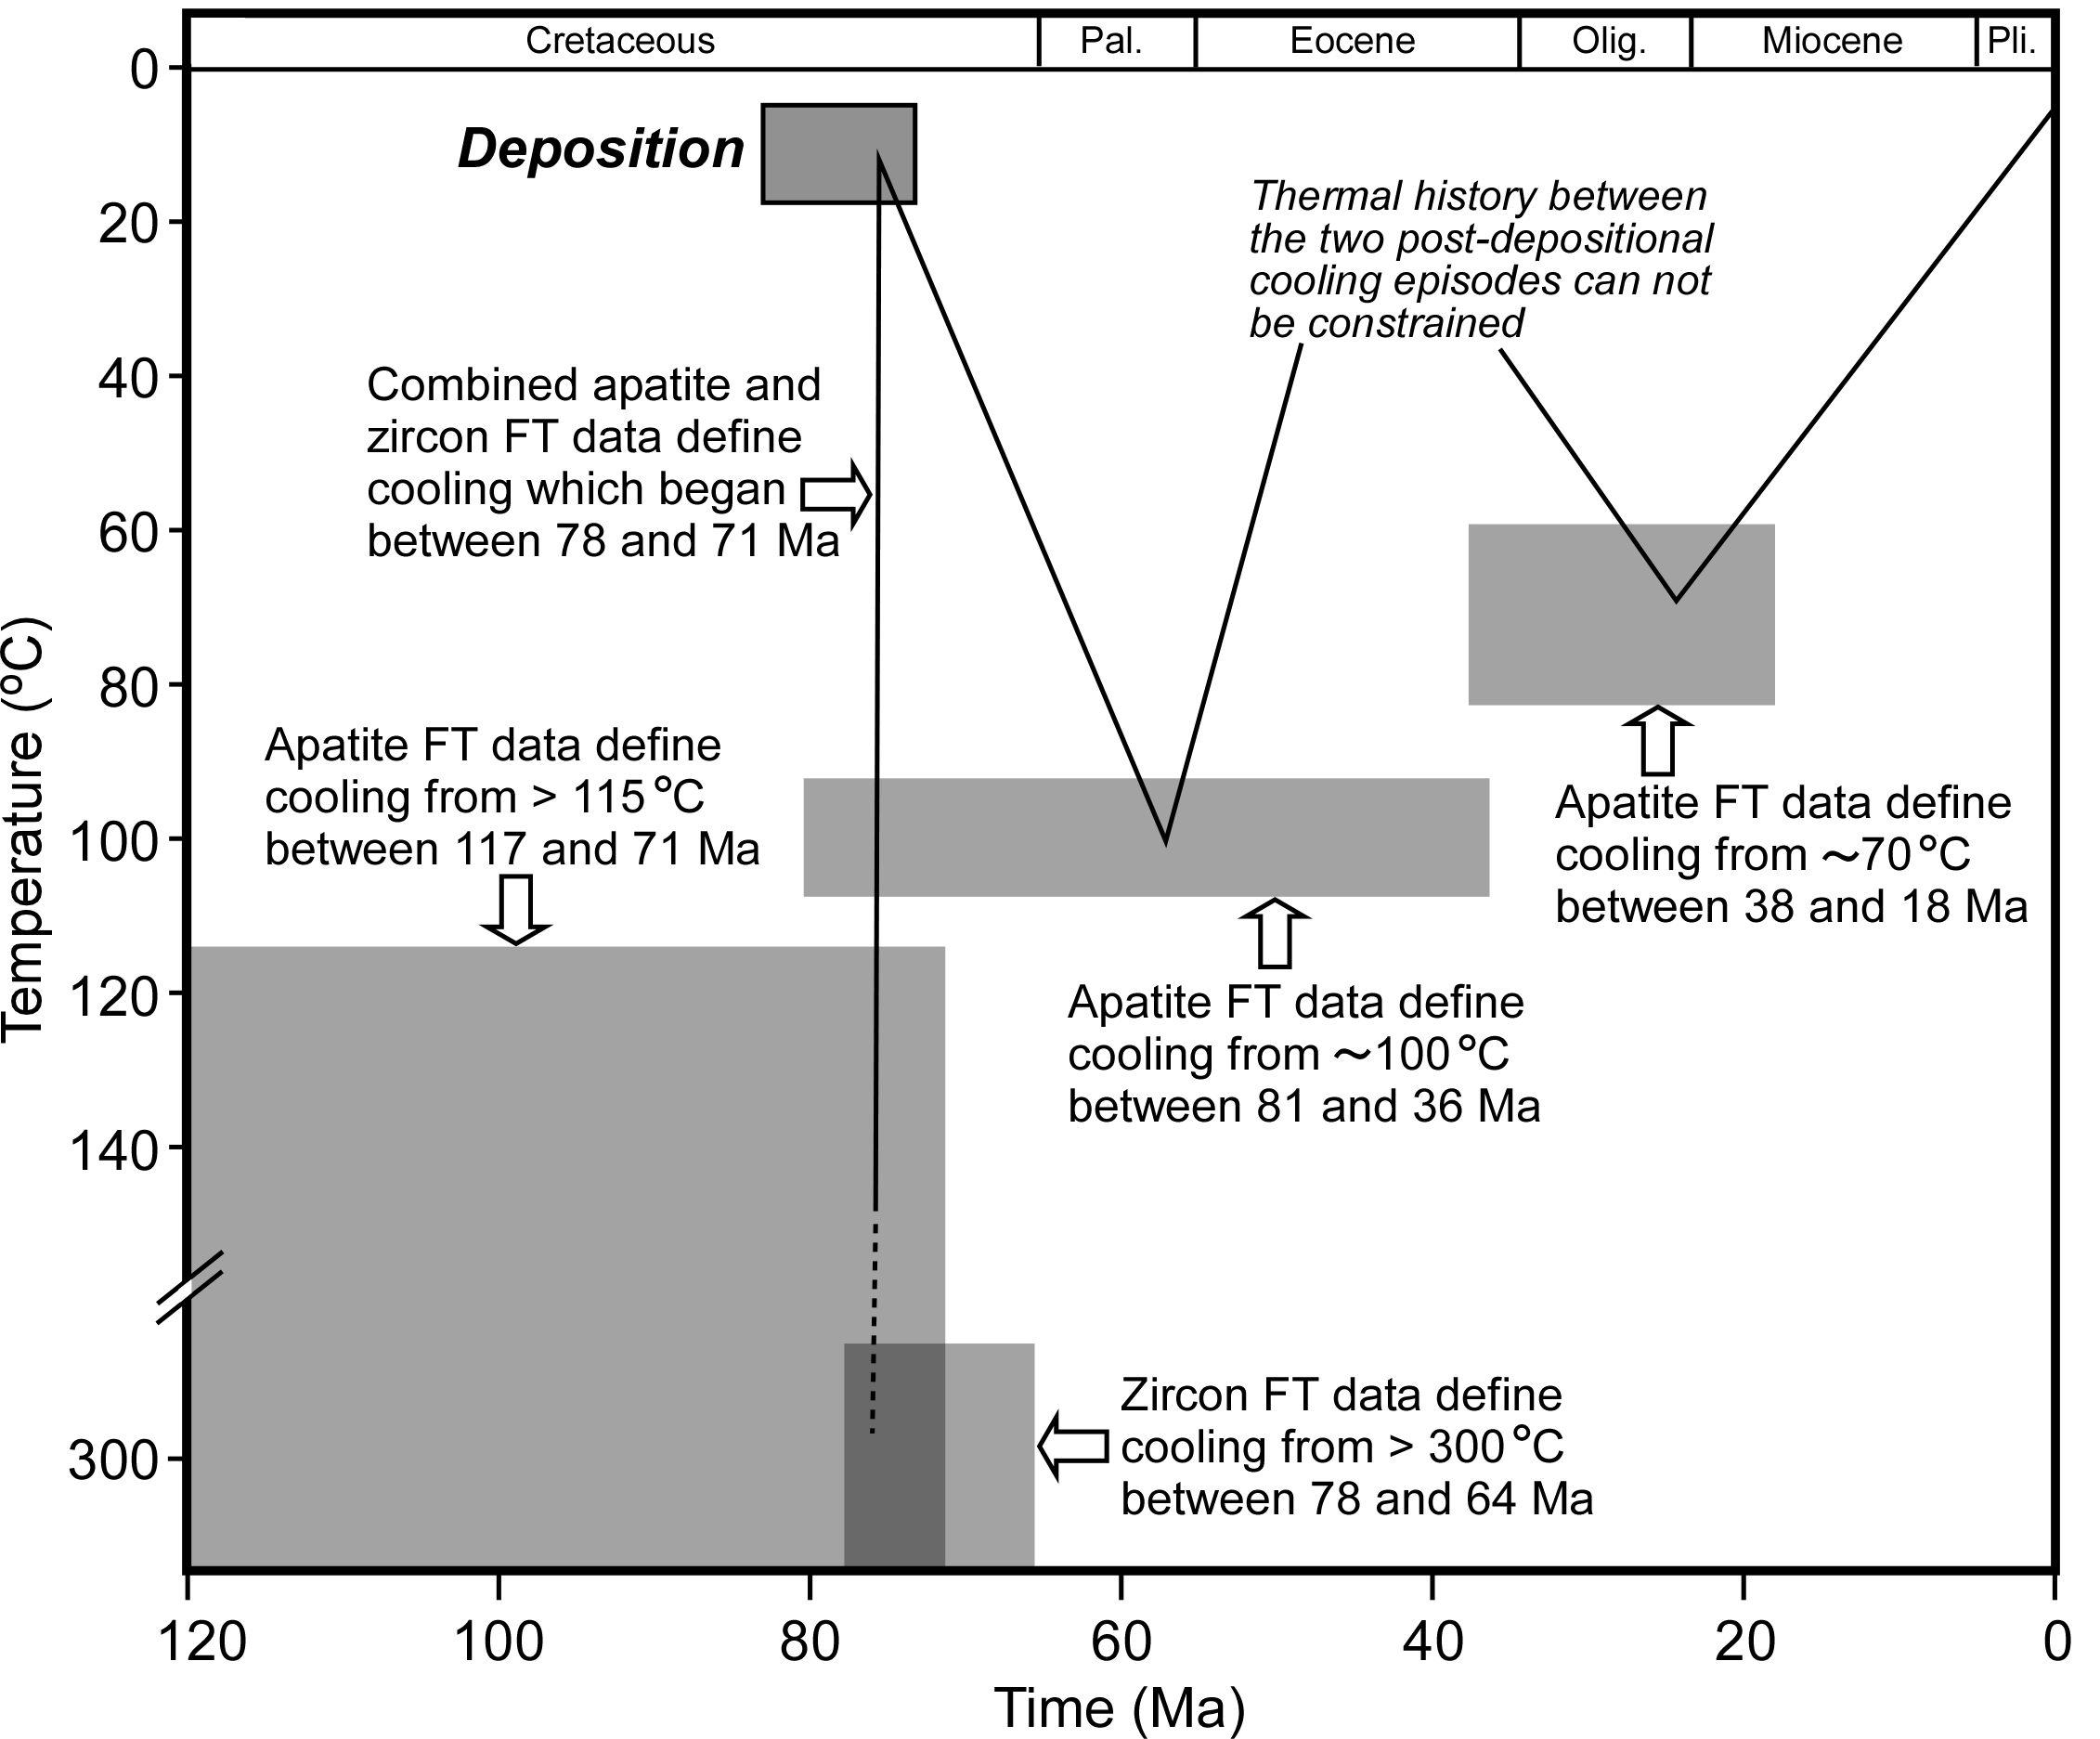
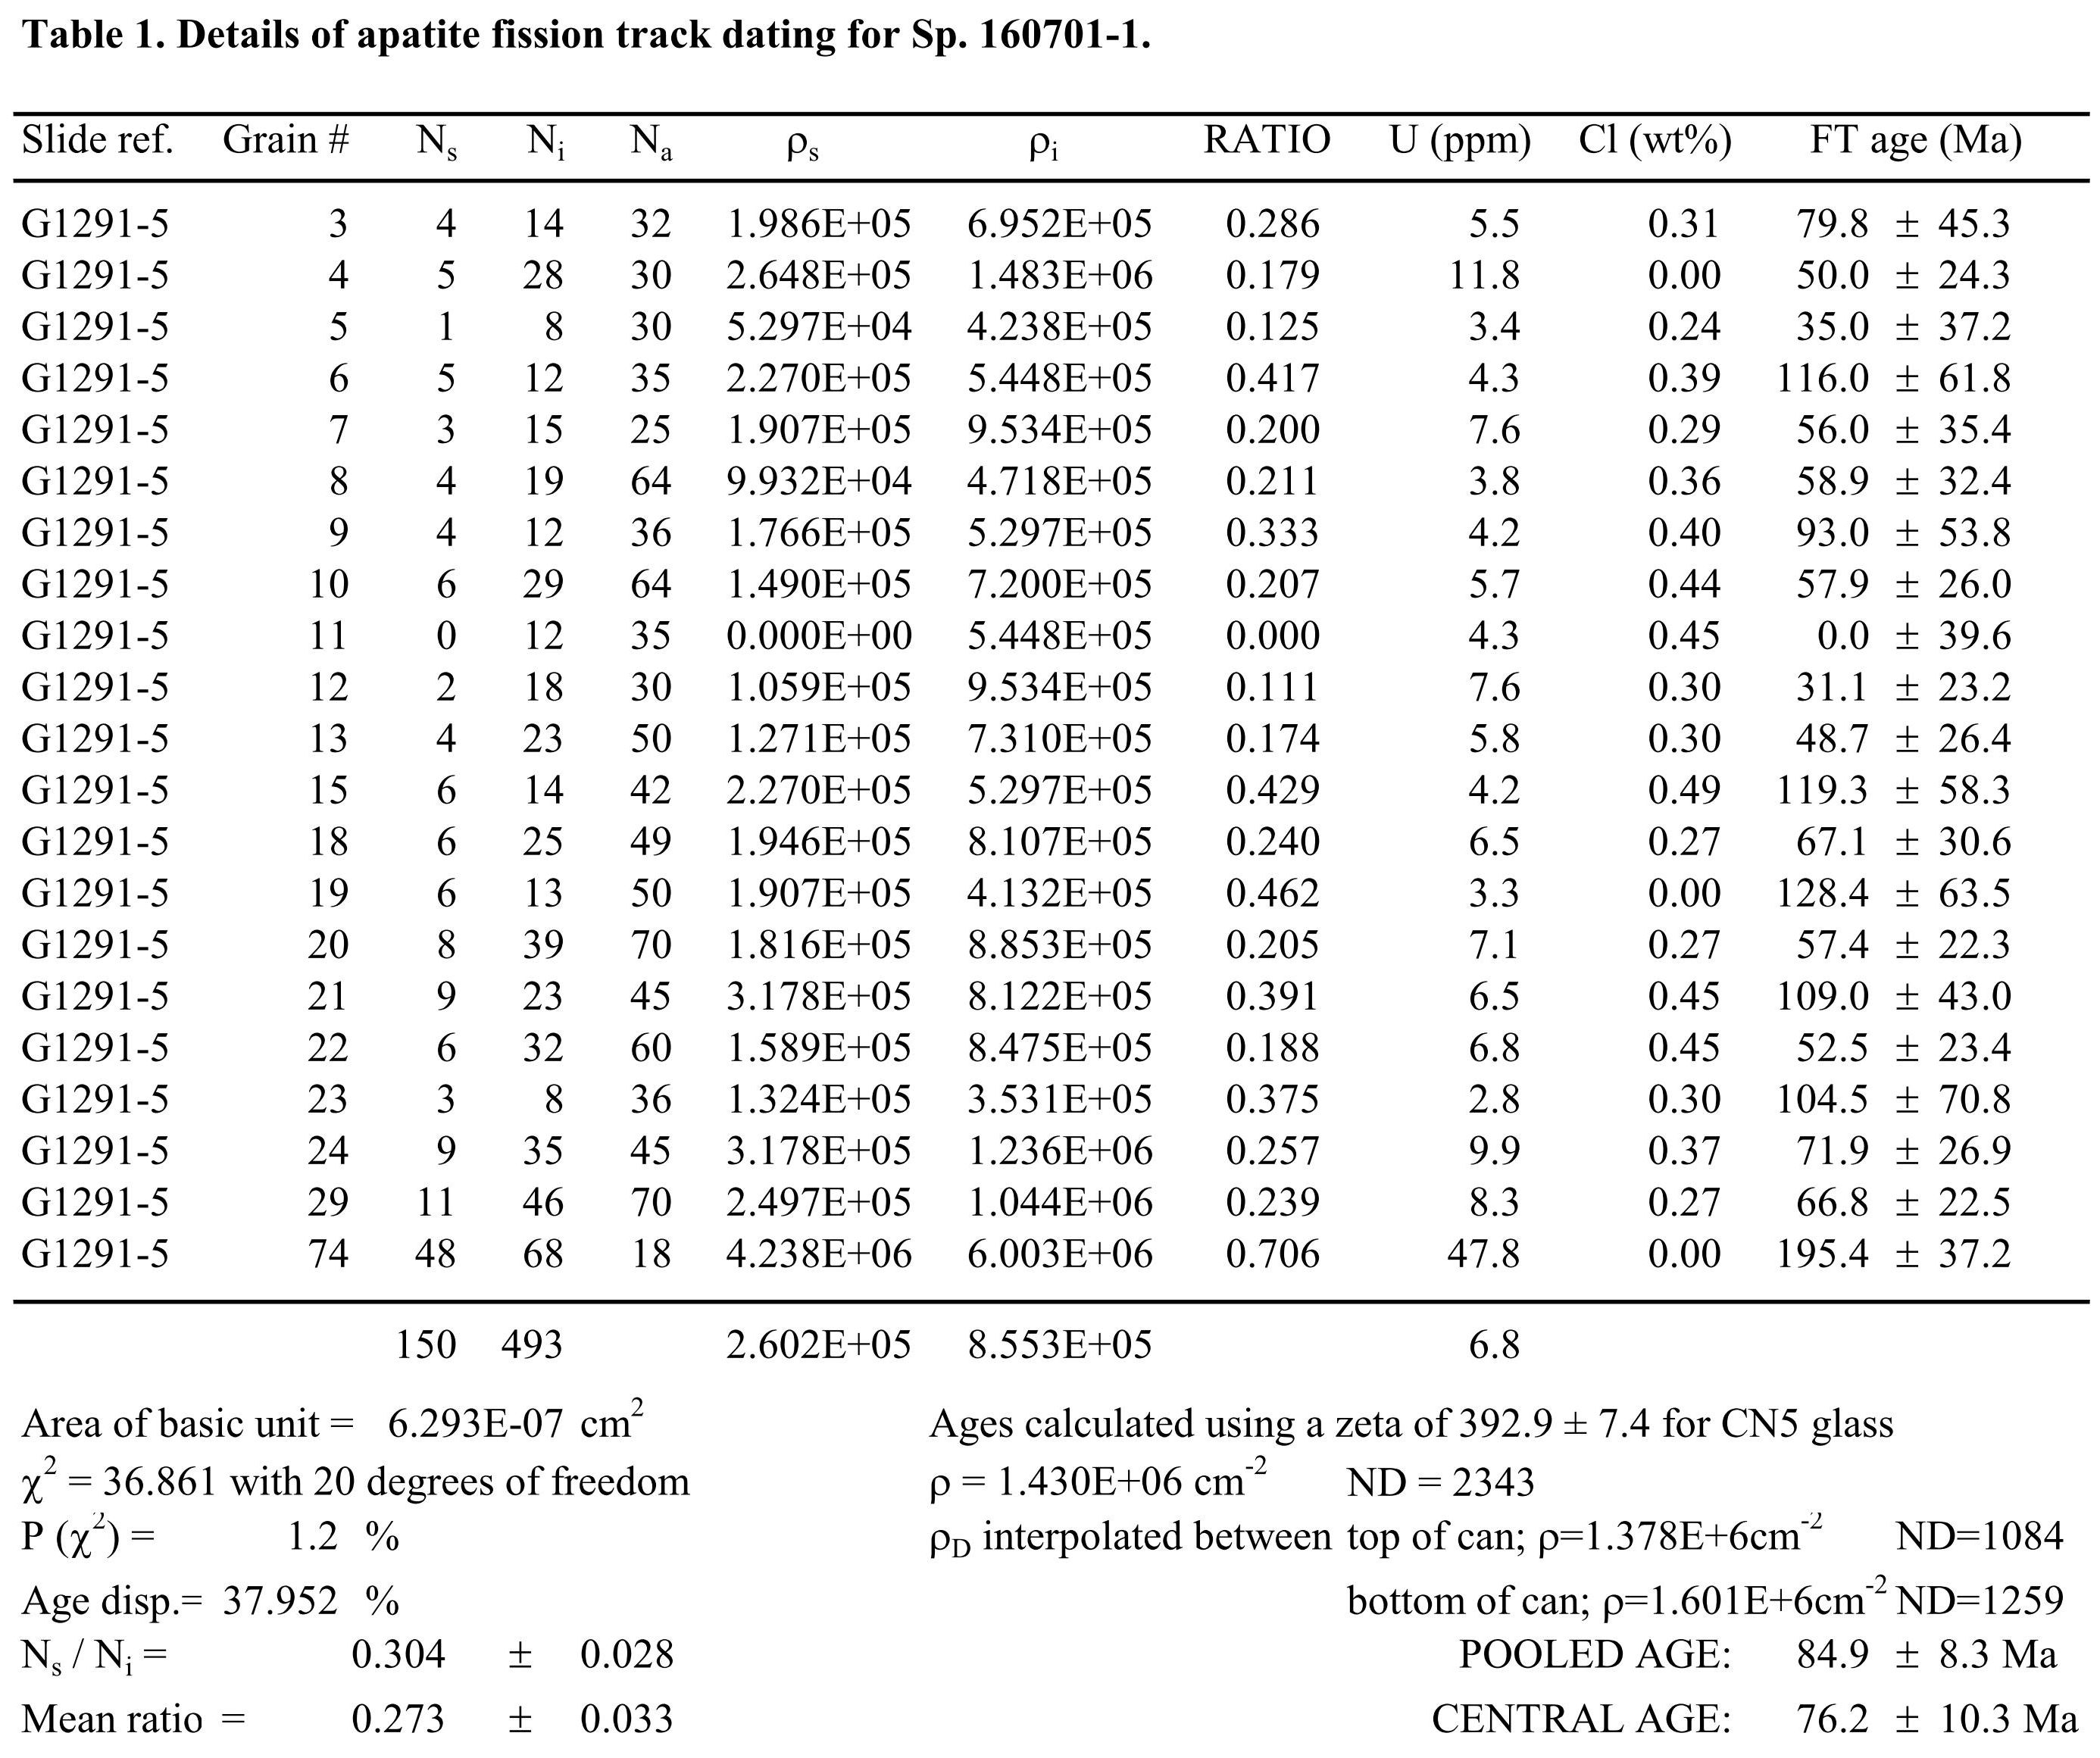
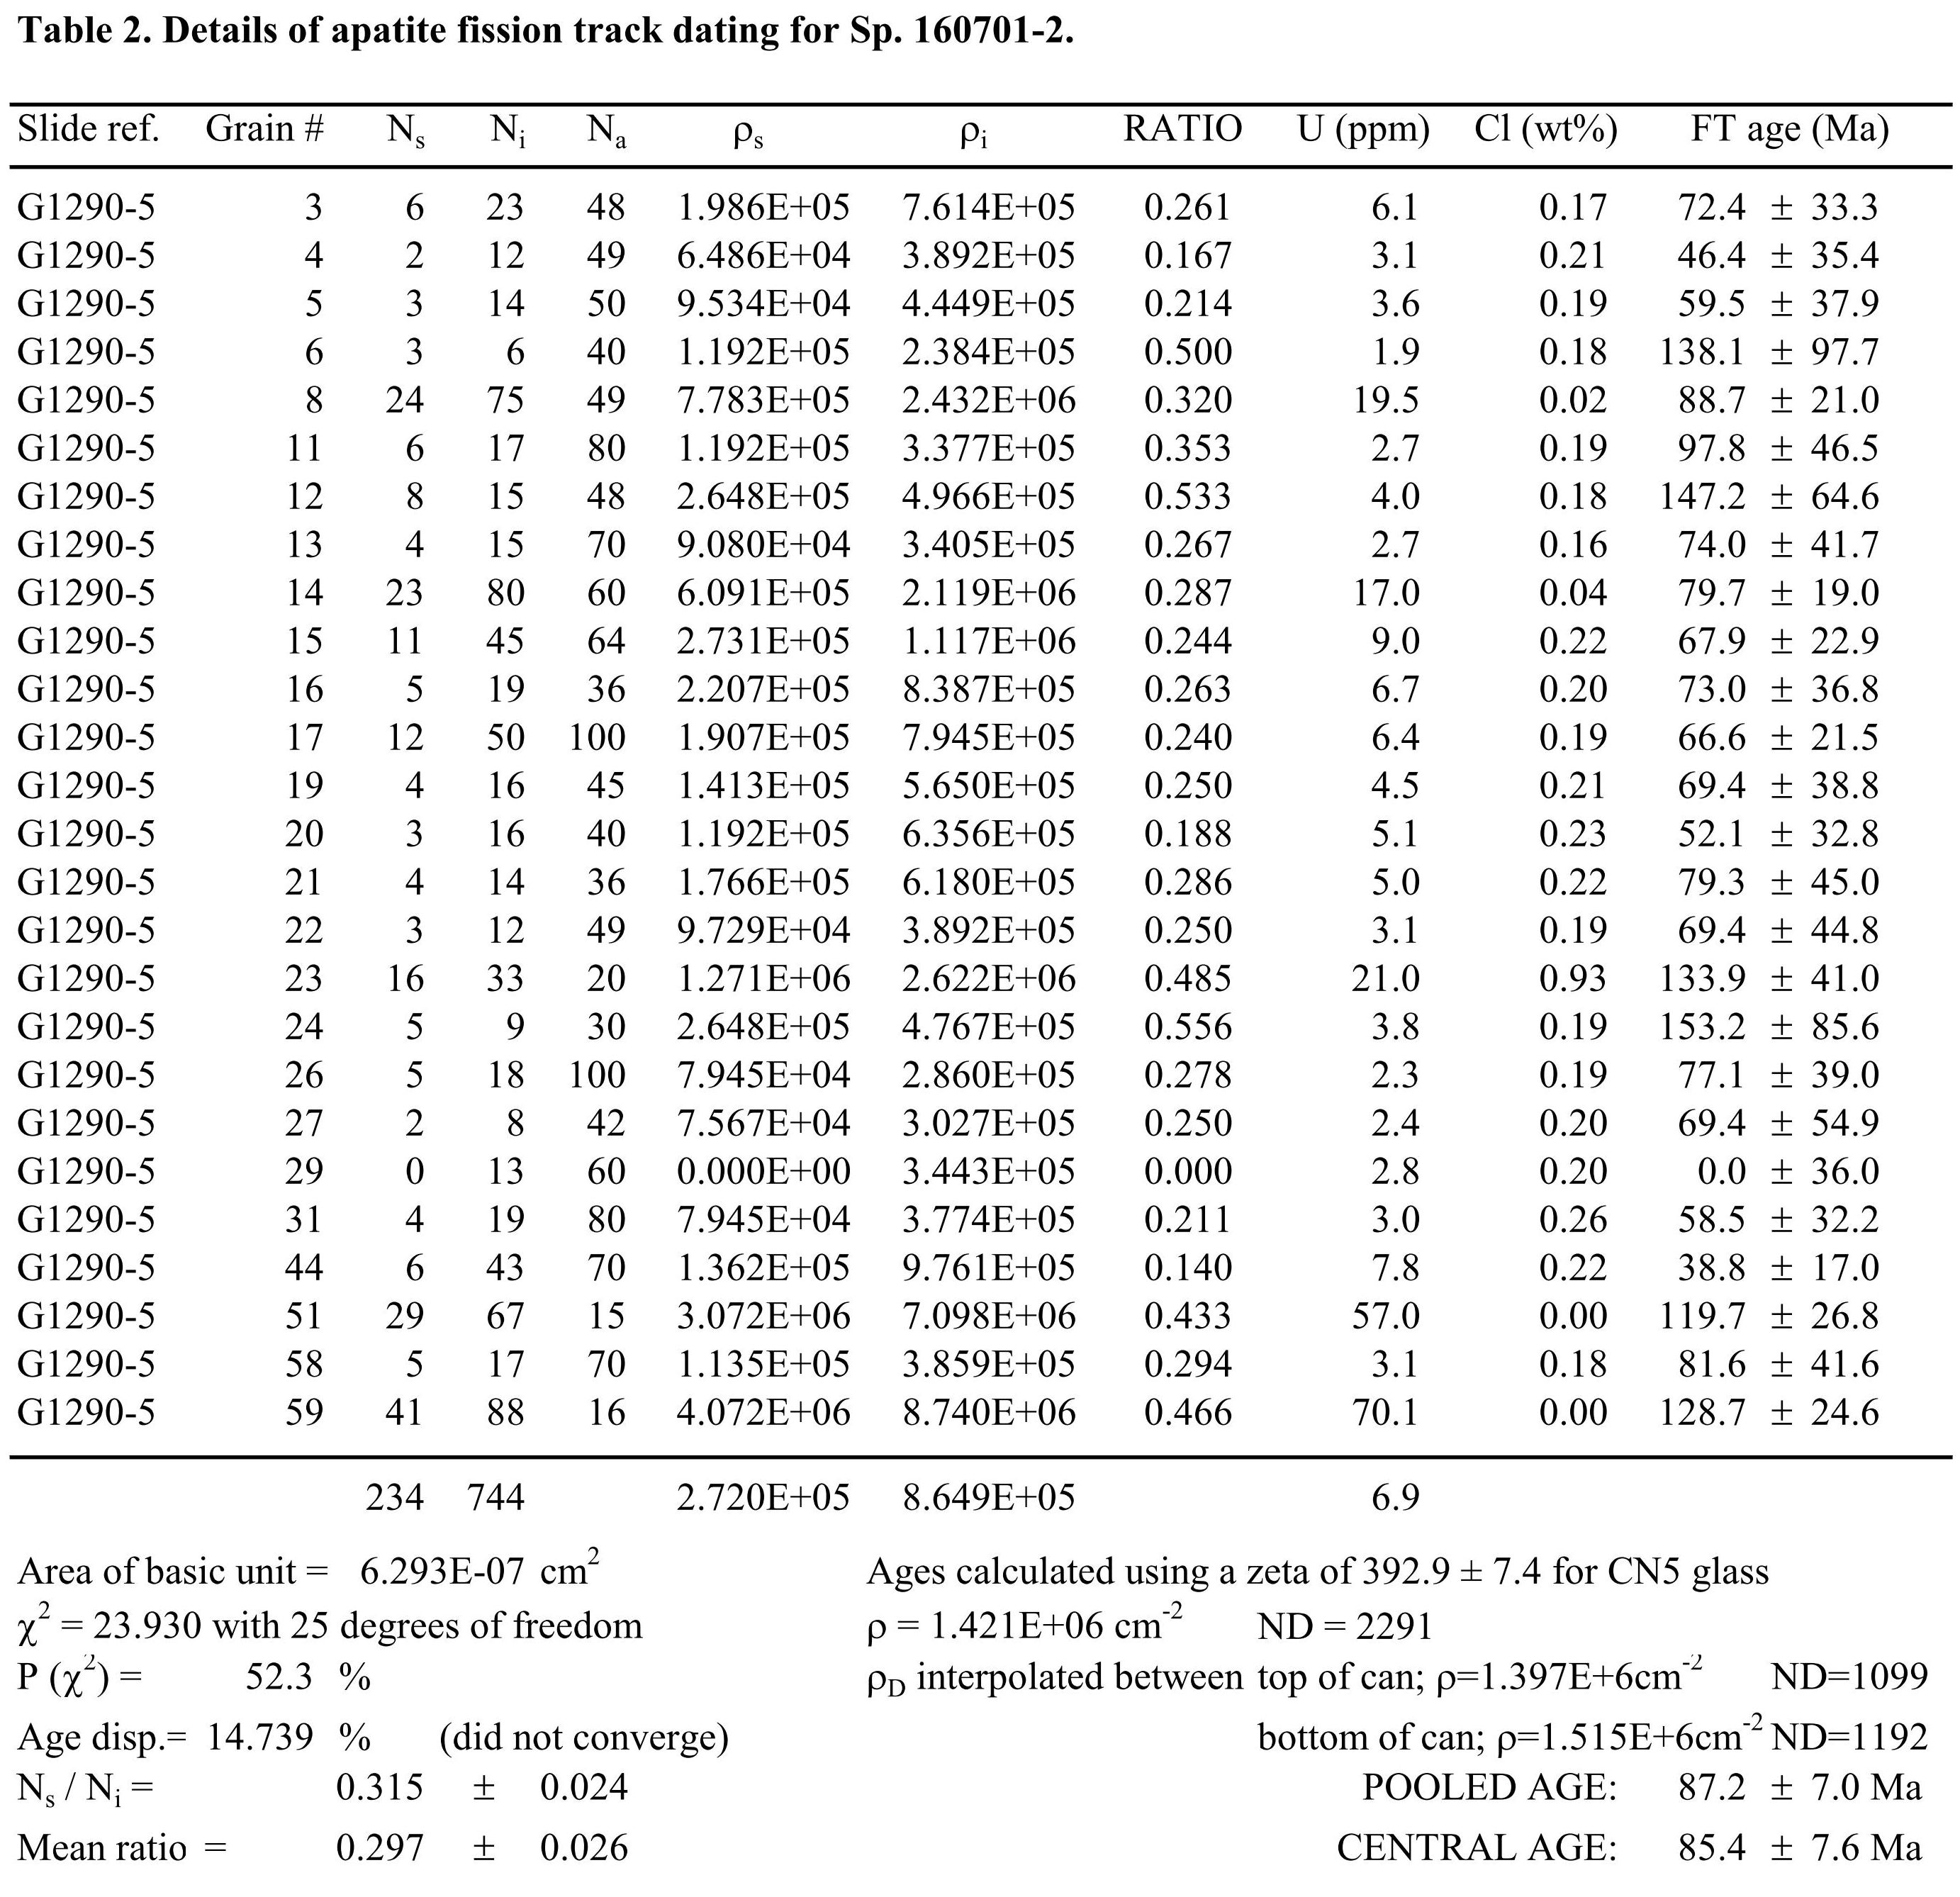
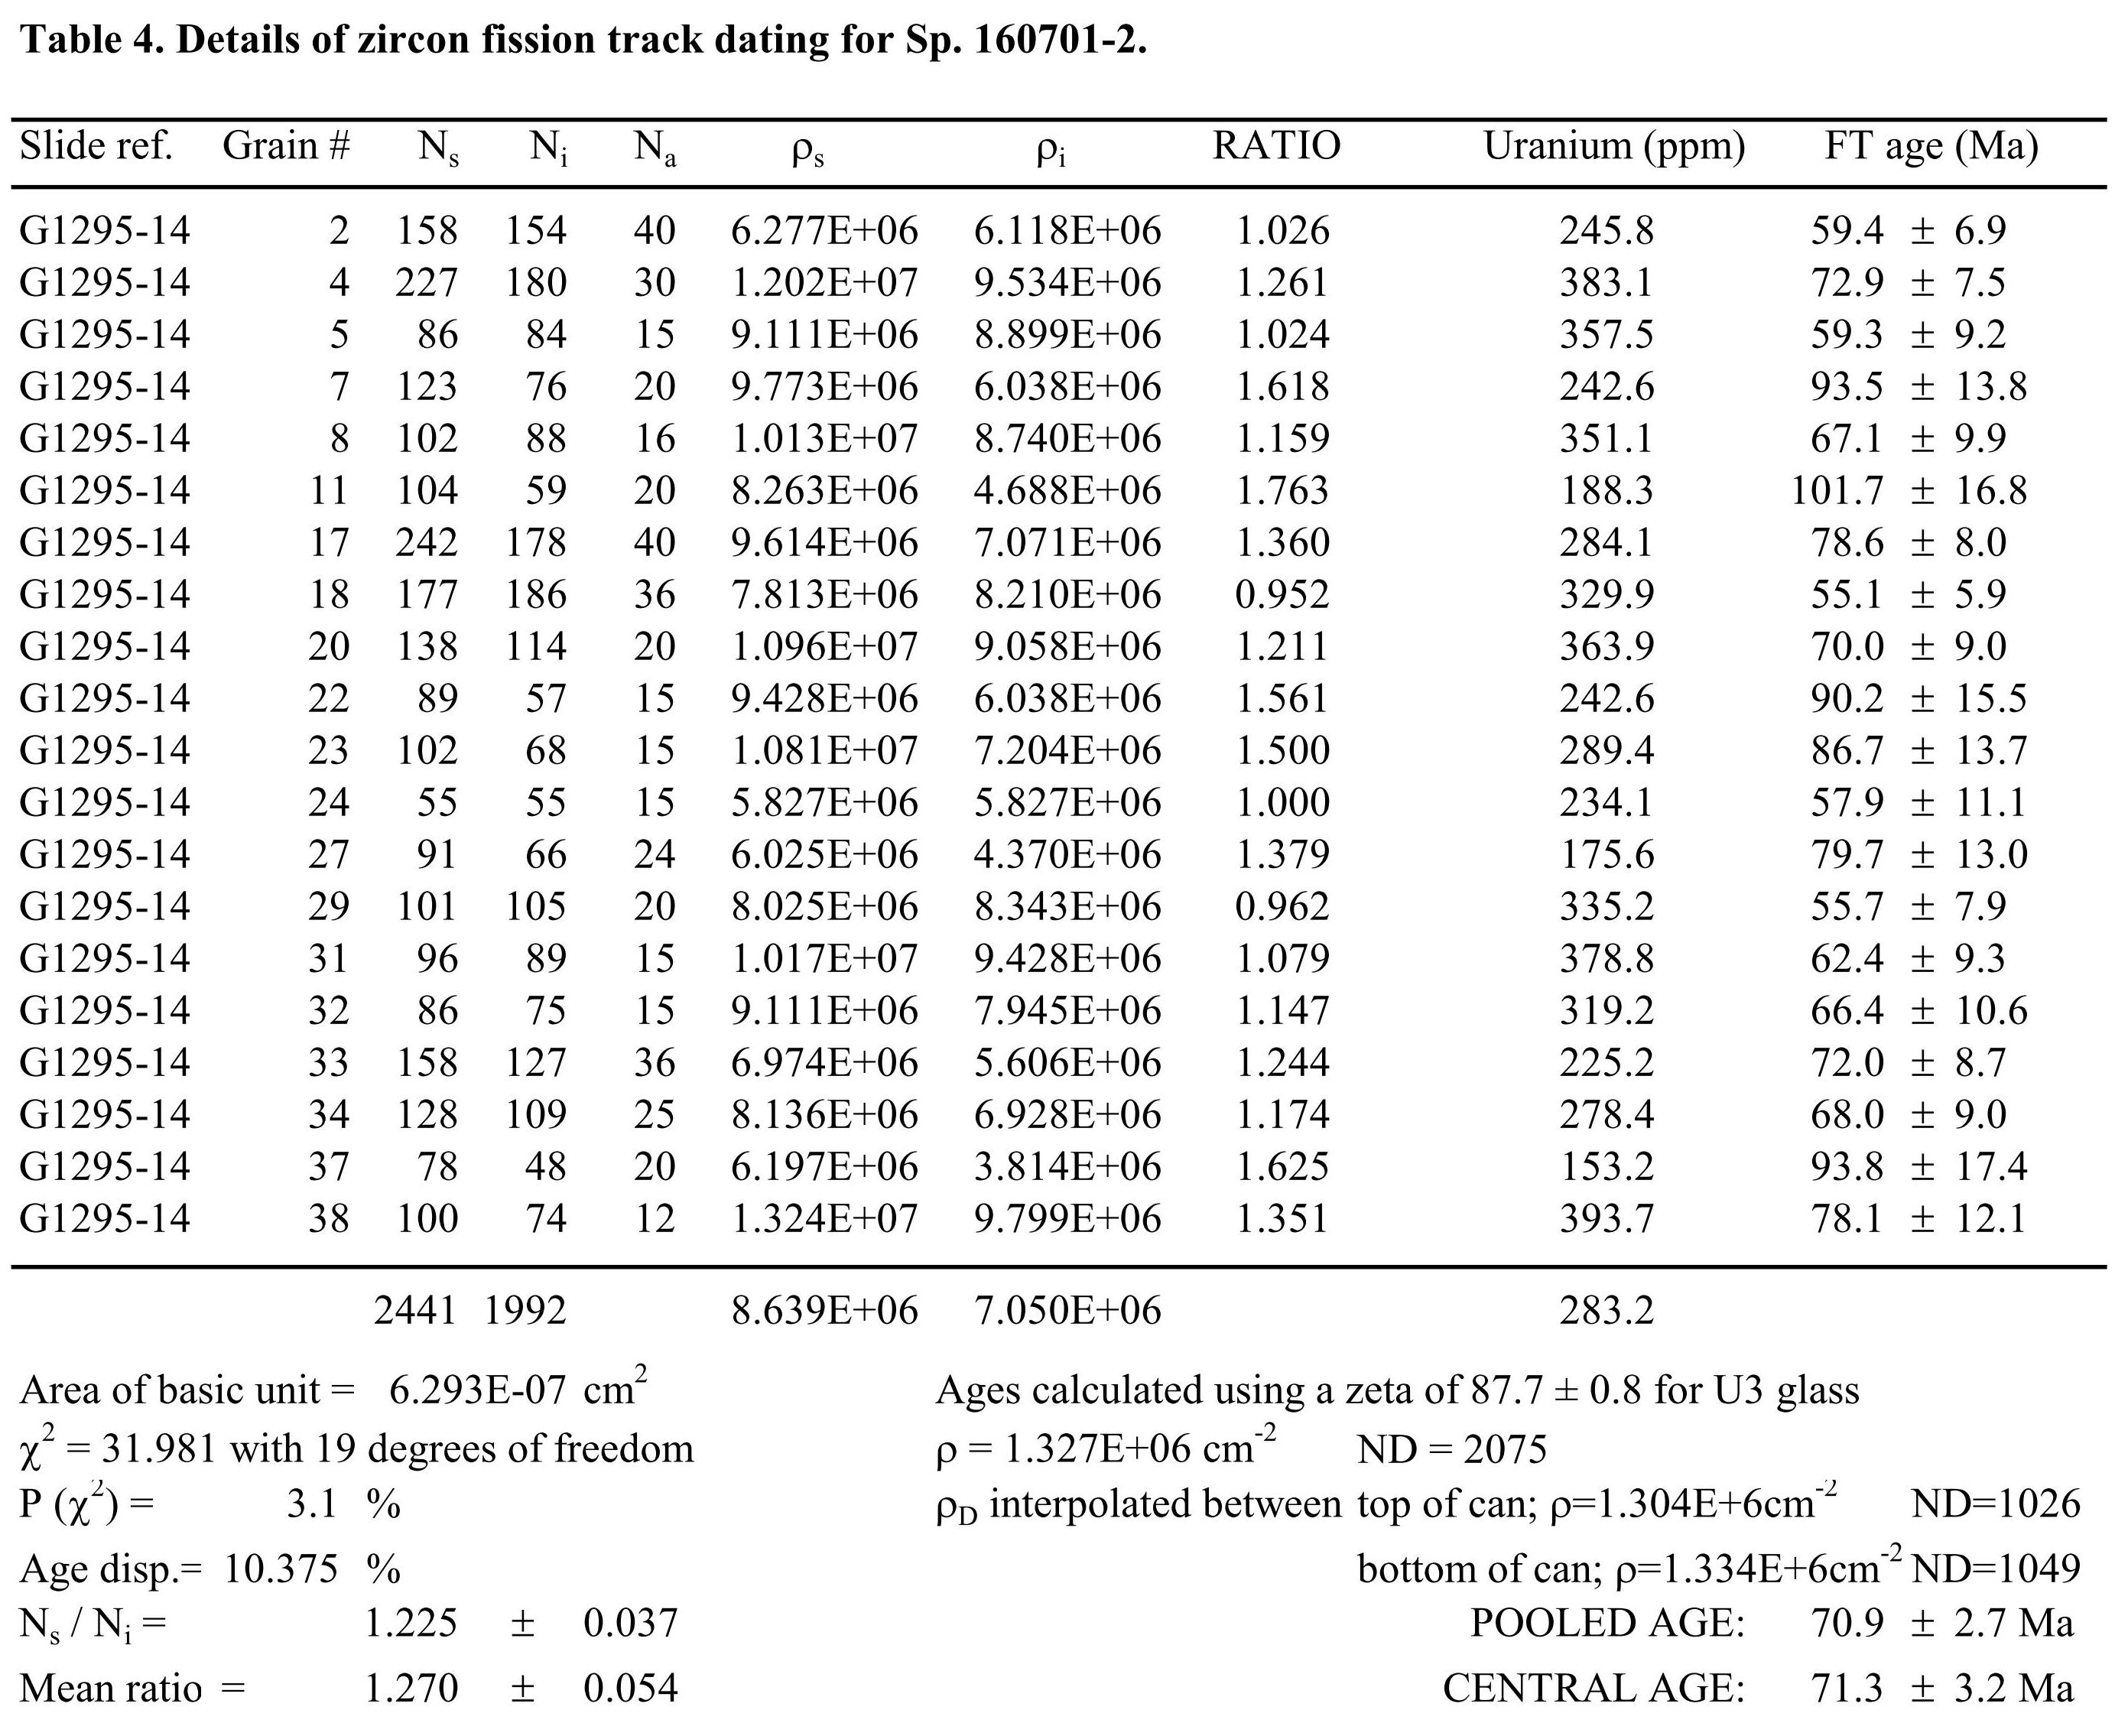
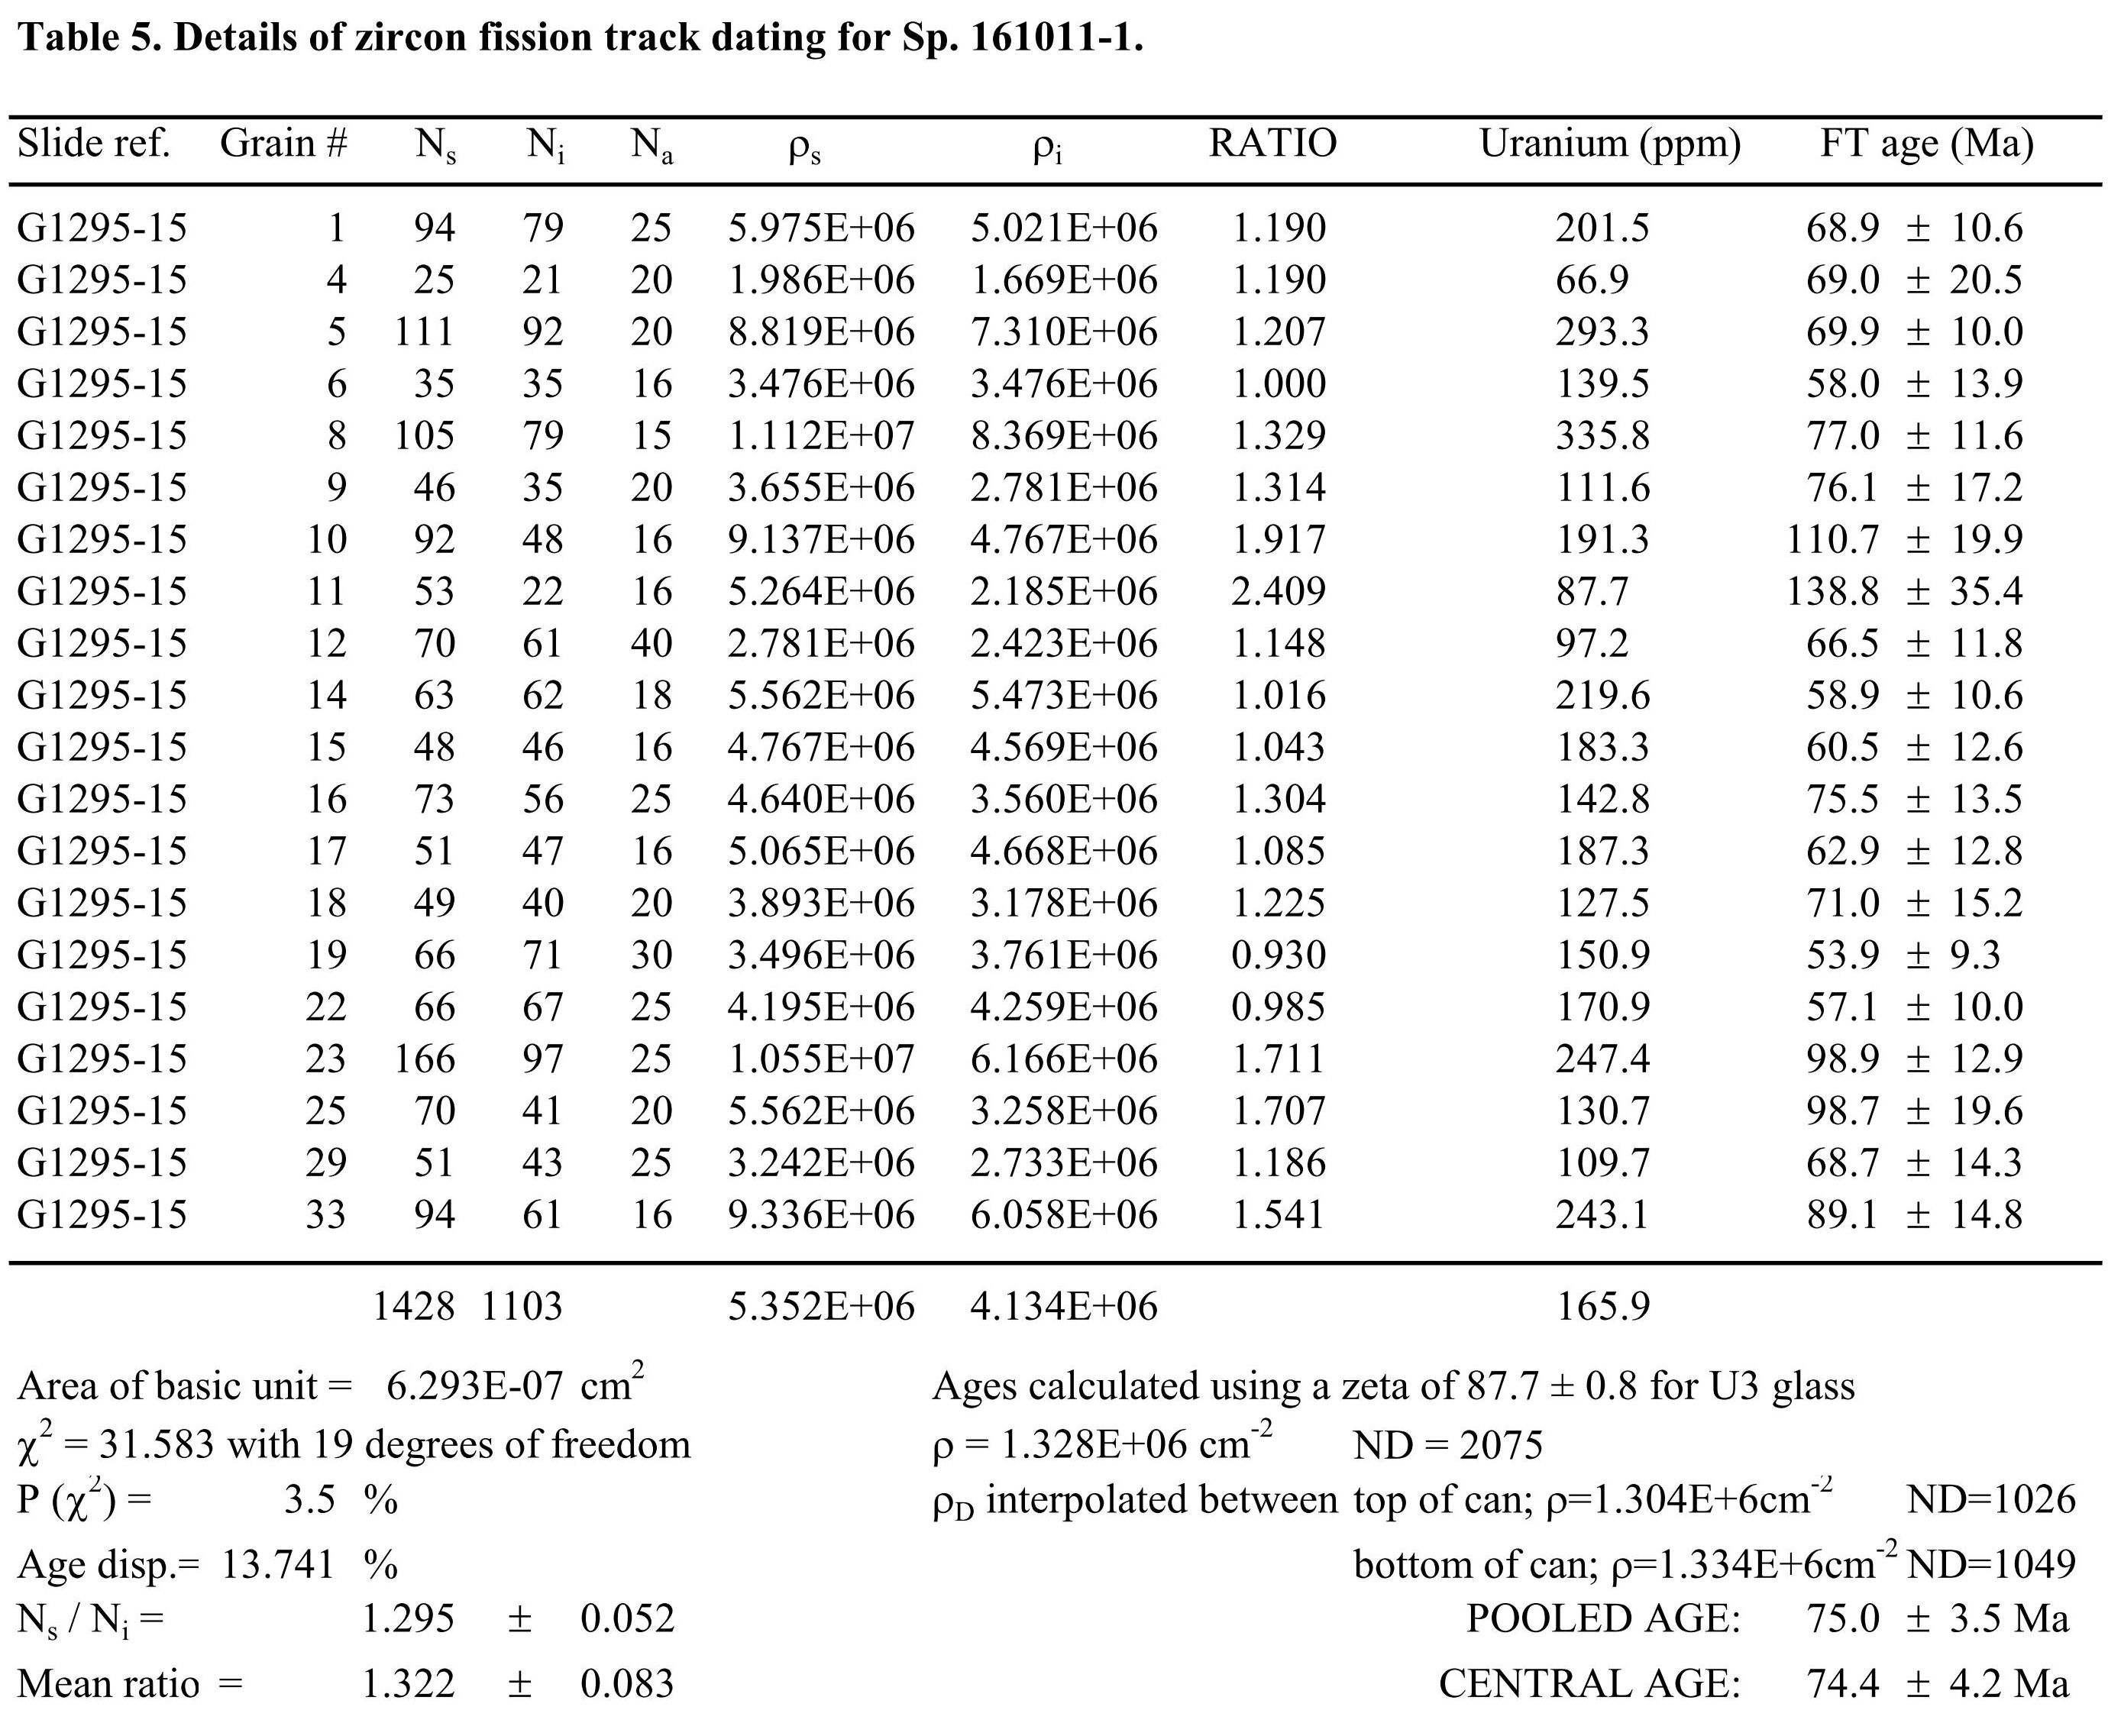
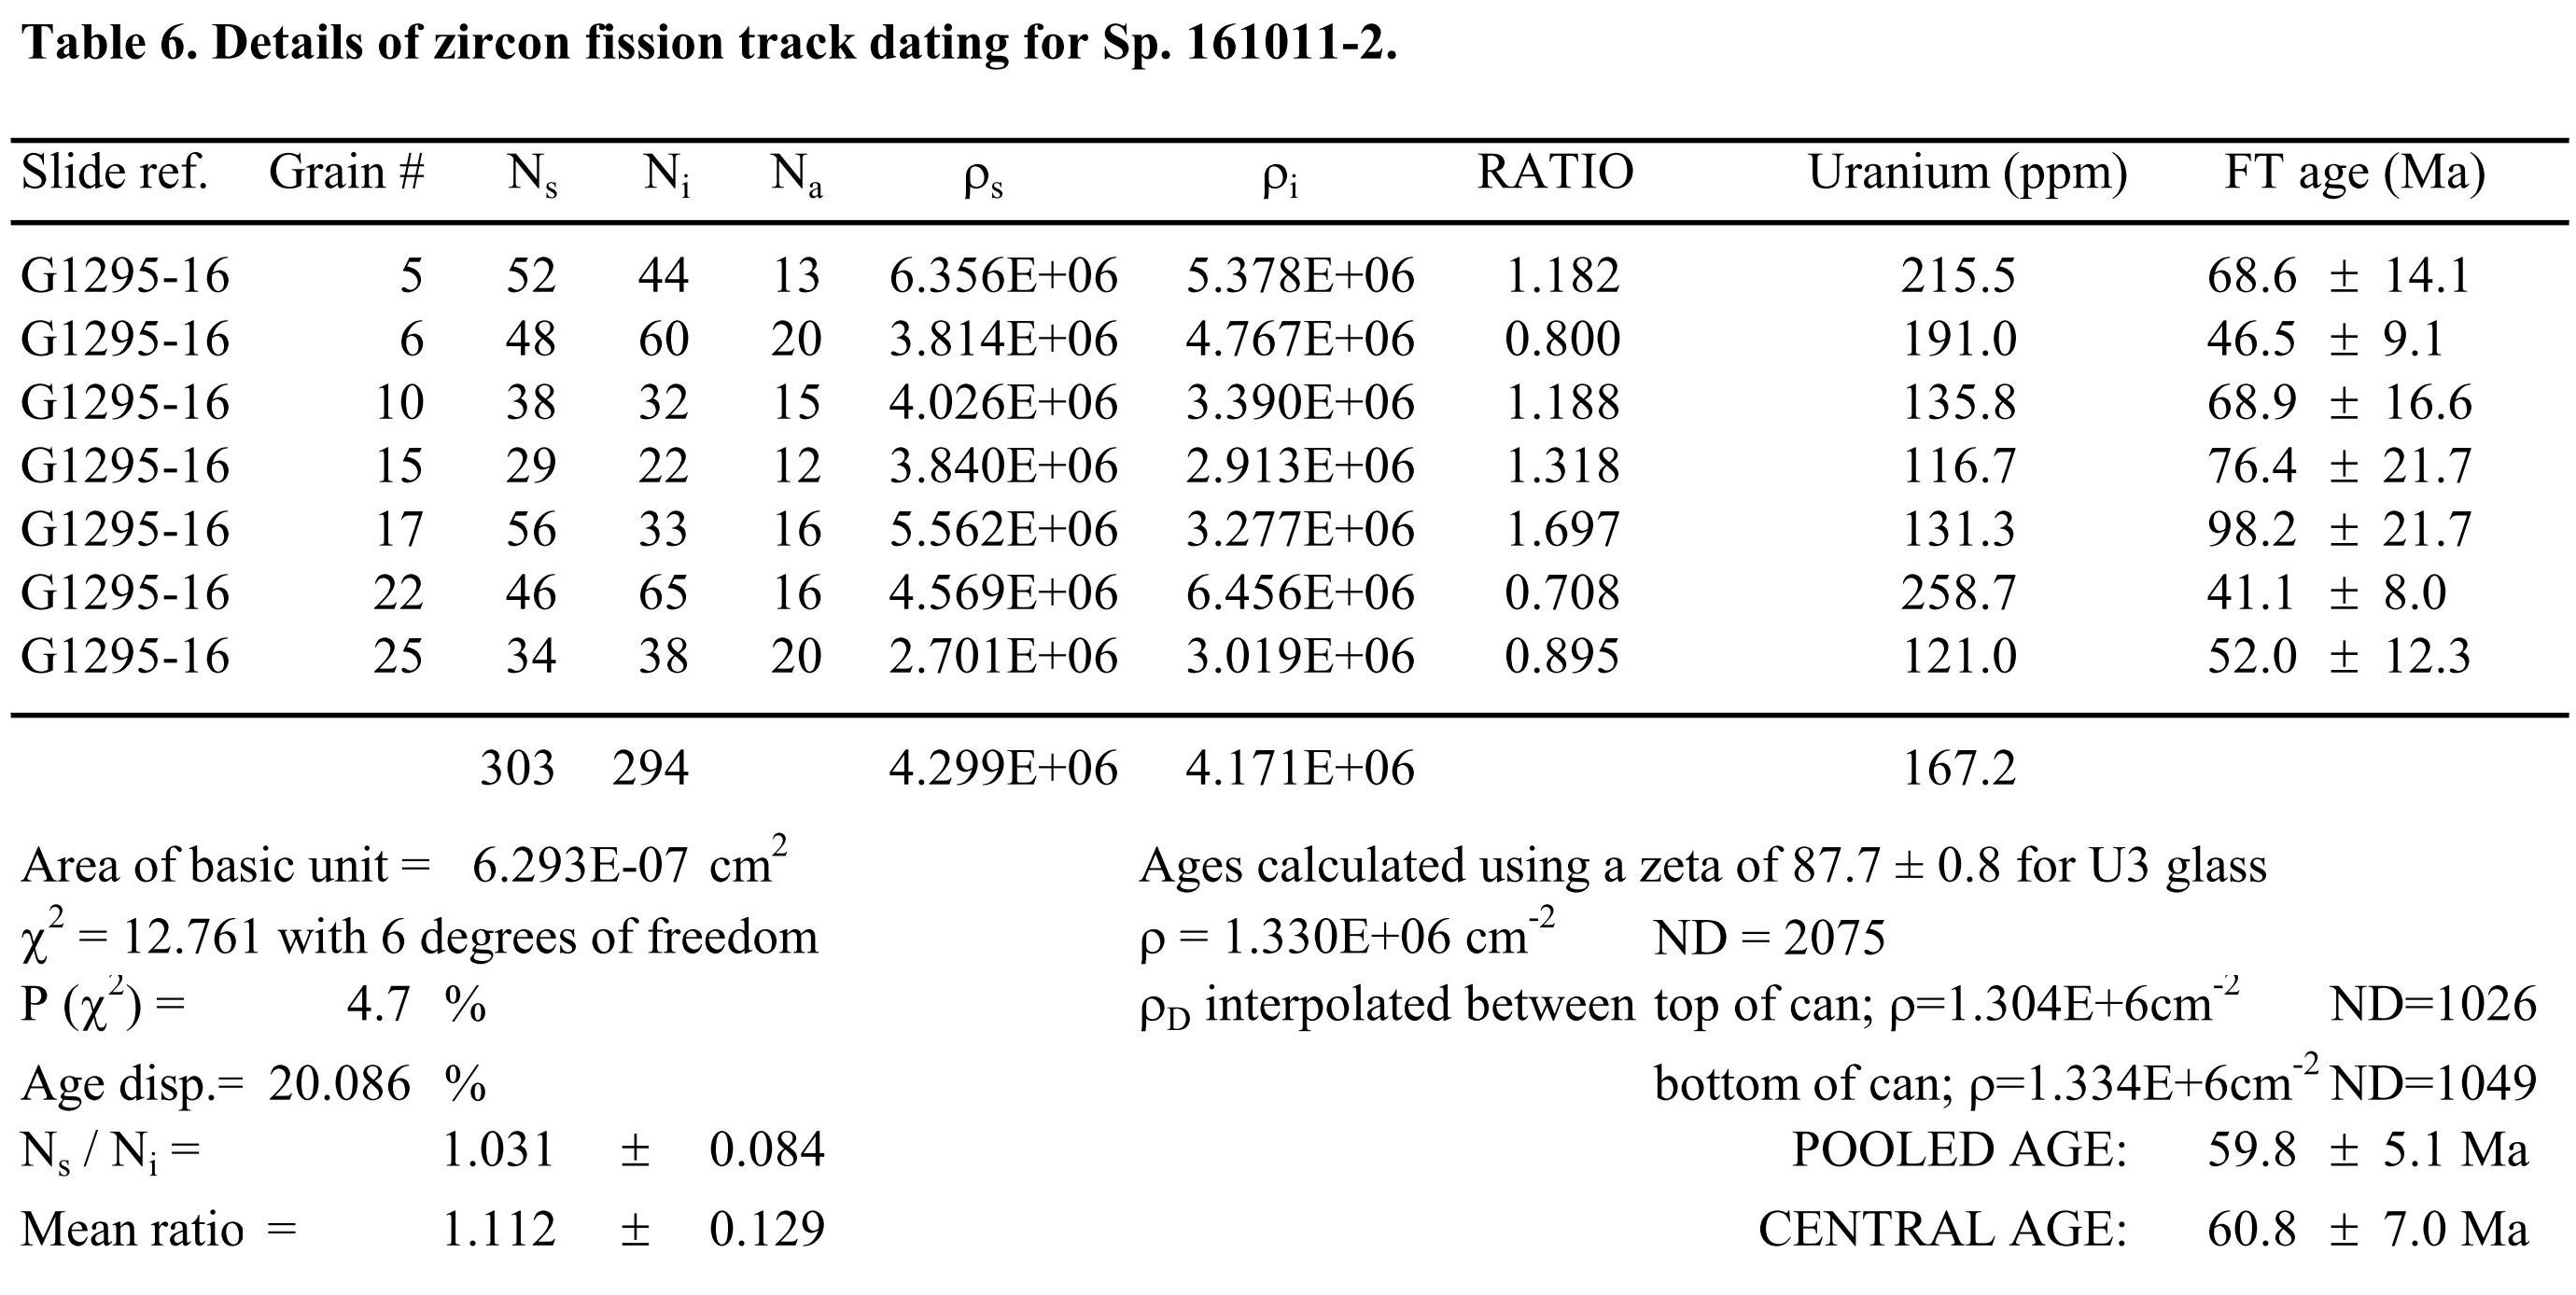
{"_buckets": {"deposit": "e3e93a34-8e80-4c8a-a566-0bbdc18d89c8"}, "_deposit": {"created_by": 1, "id": "827", "owners": [1], "pid": {"revision_id": 0, "type": "depid", "value": "827"}, "status": "published"}, "_oai": {"id": "oai:omu.repo.nii.ac.jp:00000827", "sets": ["170", "171", "172"]}, "author_link": ["3331", "3333", "3332", "3330", "3329"], "item_13_alternative_title_20": {"attribute_name": "その他のタイトル", "attribute_value_mlt": [{"subitem_alternative_title": "アパタイトのフィッショントラック解析及び微量元素組成に基づく東アジア収束境界の白亜紀イベント堆積シーケンスの熱史・テフラ年代学的研究"}]}, "item_13_biblio_info_7": {"attribute_name": "書誌情報", "attribute_value_mlt": [{"bibliographicIssueDates": {"bibliographicIssueDate": "2017", "bibliographicIssueDateType": "Issued"}, "bibliographicPageEnd": "224", "bibliographicPageStart": "197", "bibliographicVolumeNumber": "17", "bibliographic_titles": [{"bibliographic_title": "Horizons in Earth Science Research"}]}]}, "item_13_description_16": {"attribute_name": "フォーマット", "attribute_value_mlt": [{"subitem_description": "application/pdf", "subitem_description_type": "Other"}]}, "item_13_description_41": {"attribute_name": "資源タイプ", "attribute_value_mlt": [{"subitem_description": "Book chapter", "subitem_description_type": "Other"}]}, "item_13_description_6": {"attribute_name": "引用", "attribute_value_mlt": [{"subitem_description": "Horizons in Earth Science Research. 17, p.197-224", "subitem_description_type": "Other"}]}, "item_13_full_name_3": {"attribute_name": "著者別名", "attribute_value_mlt": [{"nameIdentifiers": [{"nameIdentifier": "3333", "nameIdentifierScheme": "WEKO"}], "names": [{"name": "伊藤, 康人"}]}]}, "item_13_publisher_34": {"attribute_name": "出版者", "attribute_value_mlt": [{"subitem_publisher": "Nova Science Publishers, Inc."}]}, "item_13_version_type_17": {"attribute_name": "著者版フラグ", "attribute_value_mlt": [{"subitem_version_resource": "http://purl.org/coar/version/c_970fb48d4fbd8a85", "subitem_version_type": "VoR"}]}, "item_creator": {"attribute_name": "著者", "attribute_type": "creator", "attribute_value_mlt": [{"creatorNames": [{"creatorName": "Itoh, Yasuto"}], "nameIdentifiers": [{"nameIdentifier": "3329", "nameIdentifierScheme": "WEKO"}]}, {"creatorNames": [{"creatorName": "Green, Paul F"}], "nameIdentifiers": [{"nameIdentifier": "3330", "nameIdentifierScheme": "WEKO"}]}, {"creatorNames": [{"creatorName": "Takashima, Reishi"}], "nameIdentifiers": [{"nameIdentifier": "3331", "nameIdentifierScheme": "WEKO"}]}, {"creatorNames": [{"creatorName": "Takemura, Keiji"}], "nameIdentifiers": [{"nameIdentifier": "3332", "nameIdentifierScheme": "WEKO"}]}]}, "item_files": {"attribute_name": "ファイル情報", "attribute_type": "file", "attribute_value_mlt": [{"accessrole": "open_date", "date": [{"dateType": "Available", "dateValue": "2019-07-29"}], "displaytype": "detail", "download_preview_message": "", "file_order": 0, "filename": "2018000172.pdf", "filesize": [{"value": "4.3 MB"}], "format": "application/pdf", "future_date_message": "", "is_thumbnail": false, "licensetype": "license_free", "mimetype": "application/pdf", "size": 4300000.0, "url": {"label": "2018000172", "url": "https://omu.repo.nii.ac.jp/record/827/files/2018000172.pdf"}, "version_id": "4144af71-a0e5-4071-942d-391500d86161"}, {"accessrole": "open_date", "date": [{"dateType": "Available", "dateValue": "2019-07-29"}], "displaytype": "detail", "download_preview_message": "", "file_order": 1, "filename": "Figure_1.jpg", "filesize": [{"value": "1.1 MB"}], "format": "image/jpeg", "future_date_message": "", "is_thumbnail": false, "licensetype": "license_free", "mimetype": "image/jpeg", "size": 1100000.0, "url": {"label": "Figure_1.Sampling location index. The geologic map is adapted from the Geological Survey of Japan (2012). サンプリング地点インデックス図。地質図はGeological Survey of Japan (2012)より編集。", "url": "https://omu.repo.nii.ac.jp/record/827/files/Figure_1.jpg"}, "version_id": "af0d96c9-ae78-4603-9189-7552e27327dc"}, {"accessrole": "open_date", "date": [{"dateType": "Available", "dateValue": "2019-07-29"}], "displaytype": "detail", "download_preview_message": "", "file_order": 2, "filename": "Figure_2.jpg", "filesize": [{"value": "347.9 kB"}], "format": "image/jpeg", "future_date_message": "", "is_thumbnail": false, "licensetype": "license_free", "mimetype": "image/jpeg", "size": 347900.0, "url": {"label": "Figure_2.Fission track age data for Sp. 160701-1. A: Radial plot of single grain ages. B: Distribution of Cl content in apatite grains. C: Single-grain age versus Cl weight fraction for individual apatite grains. Sp. 160701-1についてのフィッショントラック年代データ。A: 粒子年代のRadial plot。B: アパタイト粒子の塩素含有量分布。C: 粒子年代と塩素含有量の比較。D: フィッショントラック長(confined track lengths)の分布。", "url": "https://omu.repo.nii.ac.jp/record/827/files/Figure_2.jpg"}, "version_id": "455f4cee-9245-4e39-b445-18875358d461"}, {"accessrole": "open_date", "date": [{"dateType": "Available", "dateValue": "2019-07-29"}], "displaytype": "detail", "download_preview_message": "", "file_order": 3, "filename": "Figure_3.jpg", "filesize": [{"value": "326.3 kB"}], "format": "image/jpeg", "future_date_message": "", "is_thumbnail": false, "licensetype": "license_free", "mimetype": "image/jpeg", "size": 326300.0, "url": {"label": "Figure_3.Fission track age data for Sp. 160701-2. A: Radial plot of single grain ages. B: Distribution of Cl content in apatite grains. C: Single-grain age versus Cl weight fraction for individual apatite grains. D: Distribution of confined track lengths. Sp. 160701-2についてのフィッショントラック年代データ。A: 粒子年代のRadial plot。B: アパタイト粒子の塩素含有量分布。C: 粒子年代と塩素含有量の比較。D: フィッショントラック長(confined track lengths)の分布。", "url": "https://omu.repo.nii.ac.jp/record/827/files/Figure_3.jpg"}, "version_id": "7ebe8da4-c159-4bc8-b36b-4c20b05d8923"}, {"accessrole": "open_date", "date": [{"dateType": "Available", "dateValue": "2019-07-29"}], "displaytype": "detail", "download_preview_message": "", "file_order": 4, "filename": "Figure_4.jpg", "filesize": [{"value": "465.8 kB"}], "format": "image/jpeg", "future_date_message": "", "is_thumbnail": false, "licensetype": "license_free", "mimetype": "image/jpeg", "size": 465800.0, "url": {"label": "Figure_4.Binary plots of Cl vs. Mg, Mn vs. Fe, and Ce vs. Y for apatites separated from two types of volcanic ash intercalated in the Izumi Group. 和泉層群に挟在する2種類の火山灰から分離したアパタイトの塩素/マグネシウム、マンガン/鉄、セリウム/イットリウム比。", "url": "https://omu.repo.nii.ac.jp/record/827/files/Figure_4.jpg"}, "version_id": "691ba648-774c-4c23-8c97-7de45e939bc6"}, {"accessrole": "open_date", "date": [{"dateType": "Available", "dateValue": "2019-07-29"}], "displaytype": "detail", "download_preview_message": "", "file_order": 5, "filename": "Figure_5.jpg", "filesize": [{"value": "253.5 kB"}], "format": "image/jpeg", "future_date_message": "", "is_thumbnail": false, "licensetype": "license_free", "mimetype": "image/jpeg", "size": 253500.0, "url": {"label": "Figure_5.Thermal history interpretation of apatite FT analytical data for Sp. 160701-1. Hatched polygons represent the 95% confidence limits of the time-temperature estimates of significant events. Sp. 160701-1についてのアパタイトFT解析による熱史解釈。網掛け領域は、重要なイベントの時間・温度範囲の95%信頼限界を示す。", "url": "https://omu.repo.nii.ac.jp/record/827/files/Figure_5.jpg"}, "version_id": "816dcbd3-5690-44ba-b8cc-e87458487321"}, {"accessrole": "open_date", "date": [{"dateType": "Available", "dateValue": "2019-07-29"}], "displaytype": "detail", "download_preview_message": "", "file_order": 6, "filename": "Figure_6.jpg", "filesize": [{"value": "580.6 kB"}], "format": "image/jpeg", "future_date_message": "", "is_thumbnail": false, "licensetype": "license_free", "mimetype": "image/jpeg", "size": 580600.0, "url": {"label": "Figure_6.Thermal history interpretation of apatite FT analytical data for Sp. 160701-2. Hatched polygons represent the 95% confidence limits of the time-temperature estimates of significant events. Sp. 160701-2についてのアパタイトFT解析による熱史解釈。網掛け領域は、重要なイベントの時間・温度範囲の95%信頼限界を示す。", "url": "https://omu.repo.nii.ac.jp/record/827/files/Figure_6.jpg"}, "version_id": "ed81a3f6-c2d1-4085-a231-470eb23edb5d"}, {"accessrole": "open_date", "date": [{"dateType": "Available", "dateValue": "2019-07-29"}], "displaytype": "detail", "download_preview_message": "", "file_order": 7, "filename": "Figure_7.jpg", "filesize": [{"value": "655.0 kB"}], "format": "image/jpeg", "future_date_message": "", "is_thumbnail": false, "licensetype": "license_free", "mimetype": "image/jpeg", "size": 655000.0, "url": {"label": "Figure_7.Integrated thermal history reconstruction of apatite and zircon data for five outcrop volcanic ash layers of the Izumi Group in southwestern Japan. In the apatite analysis, thermal events were interpreted not from the FT ages but from the track length distribution. In the zircon analysis, the cooling interval (78-64 Ma) was obtained from the 2 sigma uncertainty of the weighted mean age. 西南日本の和泉層群中の5枚の火山灰層から得られたアパタイト・ジルコン分析に基づく総合的熱史復元。アパタイト分析については、フィッショントラック長分布に基づいて熱イベントを解釈している。ジルコン分析の冷却インターバル(78-64 Ma)は、加重平均年代の2σ誤差に基づく。", "url": "https://omu.repo.nii.ac.jp/record/827/files/Figure_7.jpg"}, "version_id": "52c0e84e-9148-464f-a1e5-266eca1a9e69"}, {"accessrole": "open_date", "date": [{"dateType": "Available", "dateValue": "2019-07-29"}], "displaytype": "detail", "download_preview_message": "", "file_order": 8, "filename": "Table_1.jpg", "filesize": [{"value": "693.9 kB"}], "format": "image/jpeg", "future_date_message": "", "is_thumbnail": false, "licensetype": "license_free", "mimetype": "image/jpeg", "size": 693900.0, "url": {"label": "Table_1.Details of apatite fission track dating for Sp. 160701-1. Sp. 160701-1から得られたアパタイトのフィッショントラック年代測定の詳細。", "url": "https://omu.repo.nii.ac.jp/record/827/files/Table_1.jpg"}, "version_id": "c3e21754-6581-4ade-8431-821760cdbe75"}, {"accessrole": "open_date", "date": [{"dateType": "Available", "dateValue": "2019-07-29"}], "displaytype": "detail", "download_preview_message": "", "file_order": 9, "filename": "Table_2.jpg", "filesize": [{"value": "838.5 kB"}], "format": "image/jpeg", "future_date_message": "", "is_thumbnail": false, "licensetype": "license_free", "mimetype": "image/jpeg", "size": 838500.0, "url": {"label": "Table_2.Details of apatite fission track dating for Sp. 160701-2. Sp. 160701-2から得られたアパタイトのフィッショントラック年代測定の詳細。", "url": "https://omu.repo.nii.ac.jp/record/827/files/Table_2.jpg"}, "version_id": "ee6cc67a-37ae-4acf-82bd-02887af89468"}, {"accessrole": "open_date", "date": [{"dateType": "Available", "dateValue": "2019-07-29"}], "displaytype": "detail", "download_preview_message": "", "file_order": 10, "filename": "Table_3.jpg", "filesize": [{"value": "683.1 kB"}], "format": "image/jpeg", "future_date_message": "", "is_thumbnail": false, "licensetype": "license_free", "mimetype": "image/jpeg", "size": 683100.0, "url": {"label": "Table_3.Details of zircon fission track dating for Sp. 160701-1. Sp. 160701-1から得られたジルコンのフィッショントラック年代測定の詳細。", "url": "https://omu.repo.nii.ac.jp/record/827/files/Table_3.jpg"}, "version_id": "1e9cdb3e-49bc-423e-ad32-c966066ccb7a"}, {"accessrole": "open_date", "date": [{"dateType": "Available", "dateValue": "2019-07-29"}], "displaytype": "detail", "download_preview_message": "", "file_order": 11, "filename": "Table_4.jpg", "filesize": [{"value": "694.1 kB"}], "format": "image/jpeg", "future_date_message": "", "is_thumbnail": false, "licensetype": "license_free", "mimetype": "image/jpeg", "size": 694100.0, "url": {"label": "Table_4.Details of zircon fission track dating for Sp. 160701-2. Sp. 160701-2から得られたジルコンのフィッショントラック年代測定の詳細。", "url": "https://omu.repo.nii.ac.jp/record/827/files/Table_4.jpg"}, "version_id": "2fbbcf7d-b394-408e-a625-01e8fe8958e0"}, {"accessrole": "open_date", "date": [{"dateType": "Available", "dateValue": "2019-07-29"}], "displaytype": "detail", "download_preview_message": "", "file_order": 12, "filename": "Table_5.jpg", "filesize": [{"value": "690.2 kB"}], "format": "image/jpeg", "future_date_message": "", "is_thumbnail": false, "licensetype": "license_free", "mimetype": "image/jpeg", "size": 690200.0, "url": {"label": "Table_5.Details of zircon fission track dating for Sp. 161011-1. Sp. 161011-1から得られたジルコンのフィッショントラック年代測定の詳細。", "url": "https://omu.repo.nii.ac.jp/record/827/files/Table_5.jpg"}, "version_id": "13ad872e-bcb6-437a-9c32-fc2b1bf58137"}, {"accessrole": "open_date", "date": [{"dateType": "Available", "dateValue": "2019-07-29"}], "displaytype": "detail", "download_preview_message": "", "file_order": 13, "filename": "Table_6.jpg", "filesize": [{"value": "379.3 kB"}], "format": "image/jpeg", "future_date_message": "", "is_thumbnail": false, "licensetype": "license_free", "mimetype": "image/jpeg", "size": 379300.0, "url": {"label": "Table_6.Details of zircon fission track dating for Sp. 161011-2. Sp. 161011-2から得られたジルコンのフィッショントラック年代測定の詳細。", "url": "https://omu.repo.nii.ac.jp/record/827/files/Table_6.jpg"}, "version_id": "5081064d-56ea-4355-a3dd-dcfc011bc3c1"}, {"accessrole": "open_date", "date": [{"dateType": "Available", "dateValue": "2019-07-29"}], "displaytype": "detail", "download_preview_message": "", "file_order": 14, "filename": "Table_7.jpg", "filesize": [{"value": "688.8 kB"}], "format": "image/jpeg", "future_date_message": "", "is_thumbnail": false, "licensetype": "license_free", "mimetype": "image/jpeg", "size": 688800.0, "url": {"label": "Table 7. Details of zircon fission track dating for Sp. 161011-4. Sp. 161011-4から得られたジルコンのフィッショントラック年代測定の詳細。", "url": "https://omu.repo.nii.ac.jp/record/827/files/Table_7.jpg"}, "version_id": "177d1168-037c-47f0-b069-5ca0e3bd1baf"}, {"accessrole": "open_date", "date": [{"dateType": "Available", "dateValue": "2019-07-29"}], "displaytype": "detail", "download_preview_message": "", "file_order": 15, "filename": "Table_8.jpg", "filesize": [{"value": "158.0 kB"}], "format": "image/jpeg", "future_date_message": "", "is_thumbnail": false, "licensetype": "license_free", "mimetype": "image/jpeg", "size": 158000.0, "url": {"label": "Table_8.Summary of length distribution of fission tracks in apatite grains. アパタイト粒子のフィッショントラック長分布。", "url": "https://omu.repo.nii.ac.jp/record/827/files/Table_8.jpg"}, "version_id": "45b2d593-30e2-47cb-9501-8689af154c39"}, {"accessrole": "open_date", "date": [{"dateType": "Available", "dateValue": "2019-07-29"}], "displaytype": "detail", "download_preview_message": "", "file_order": 16, "filename": "Table_9.jpg", "filesize": [{"value": "269.6 kB"}], "format": "image/jpeg", "future_date_message": "", "is_thumbnail": false, "licensetype": "license_free", "mimetype": "image/jpeg", "size": 269600.0, "url": {"label": "Table_9.Summary of apatite fission track analysis in two outcrop samples. 二つの露頭試料から得られたアパタイトのフィッショントラック分析の要約。", "url": "https://omu.repo.nii.ac.jp/record/827/files/Table_9.jpg"}, "version_id": "328338d7-b2e2-403c-9f9d-ca28b5bdde03"}]}, "item_keyword": {"attribute_name": "キーワード", "attribute_value_mlt": [{"subitem_subject": "convergent margin", "subitem_subject_scheme": "Other"}, {"subitem_subject": "transcurrent fault", "subitem_subject_scheme": "Other"}, {"subitem_subject": "pull-apart basin", "subitem_subject_scheme": "Other"}, {"subitem_subject": "apatite", "subitem_subject_scheme": "Other"}, {"subitem_subject": "fission track", "subitem_subject_scheme": "Other"}, {"subitem_subject": "chemical composition", "subitem_subject_scheme": "Other"}, {"subitem_subject": "thermochronology", "subitem_subject_scheme": "Other"}, {"subitem_subject": "tephrochronology", "subitem_subject_scheme": "Other"}, {"subitem_subject": "Izumi Group", "subitem_subject_scheme": "Other"}, {"subitem_subject": "Cretaceous", "subitem_subject_scheme": "Other"}, {"subitem_subject": "east Asia", "subitem_subject_scheme": "Other"}, {"subitem_subject": "収束境界", "subitem_subject_scheme": "Other"}, {"subitem_subject": "横ずれ断層", "subitem_subject_scheme": "Other"}, {"subitem_subject": "プルアパート堆積盆", "subitem_subject_scheme": "Other"}, {"subitem_subject": "アパタイト", "subitem_subject_scheme": "Other"}, {"subitem_subject": "フィッショントラック", "subitem_subject_scheme": "Other"}, {"subitem_subject": "化学組成", "subitem_subject_scheme": "Other"}, {"subitem_subject": "熱年代学", "subitem_subject_scheme": "Other"}, {"subitem_subject": "テフラ年代学", "subitem_subject_scheme": "Other"}, {"subitem_subject": "和泉層群", "subitem_subject_scheme": "Other"}, {"subitem_subject": "白亜紀", "subitem_subject_scheme": "Other"}, {"subitem_subject": "東アジア", "subitem_subject_scheme": "Other"}]}, "item_language": {"attribute_name": "言語", "attribute_value_mlt": [{"subitem_language": "eng"}]}, "item_resource_type": {"attribute_name": "資源タイプ", "attribute_value_mlt": [{"resourcetype": "book", "resourceuri": "http://purl.org/coar/resource_type/c_2f33"}]}, "item_title": "Fission track analysis and trace element compositions of apatite for thermo- and tephrochronology of a Cretaceous event sedimentary sequence on the east Asian convergent margin", "item_titles": {"attribute_name": "タイトル", "attribute_value_mlt": [{"subitem_title": "Fission track analysis and trace element compositions of apatite for thermo- and tephrochronology of a Cretaceous event sedimentary sequence on the east Asian convergent margin"}]}, "item_type_id": "13", "owner": "1", "path": ["171", "172"], "permalink_uri": "http://hdl.handle.net/10466/15970", "pubdate": {"attribute_name": "公開日", "attribute_value": "2018-05-29"}, "publish_date": "2018-05-29", "publish_status": "0", "recid": "827", "relation": {}, "relation_version_is_last": true, "title": ["Fission track analysis and trace element compositions of apatite for thermo- and tephrochronology of a Cretaceous event sedimentary sequence on the east Asian convergent margin"], "weko_shared_id": 1}
Fission track analysis and trace element compositions of apatite for thermo- and tephrochronology of a Cretaceous event sedimentary sequence on the east Asian convergent margin
http://hdl.handle.net/10466/15970
http://hdl.handle.net/10466/1597001c56c7c-13b4-4688-8a5c-c81d43c5def4
| Item type | 図書 / Book(1) | |||||
|---|---|---|---|---|---|---|
| 公開日 | 2018-05-29 | |||||
| タイトル | ||||||
| タイトル | Fission track analysis and trace element compositions of apatite for thermo- and tephrochronology of a Cretaceous event sedimentary sequence on the east Asian convergent margin | |||||
| 言語 | ||||||
| 言語 | eng | |||||
| キーワード | ||||||
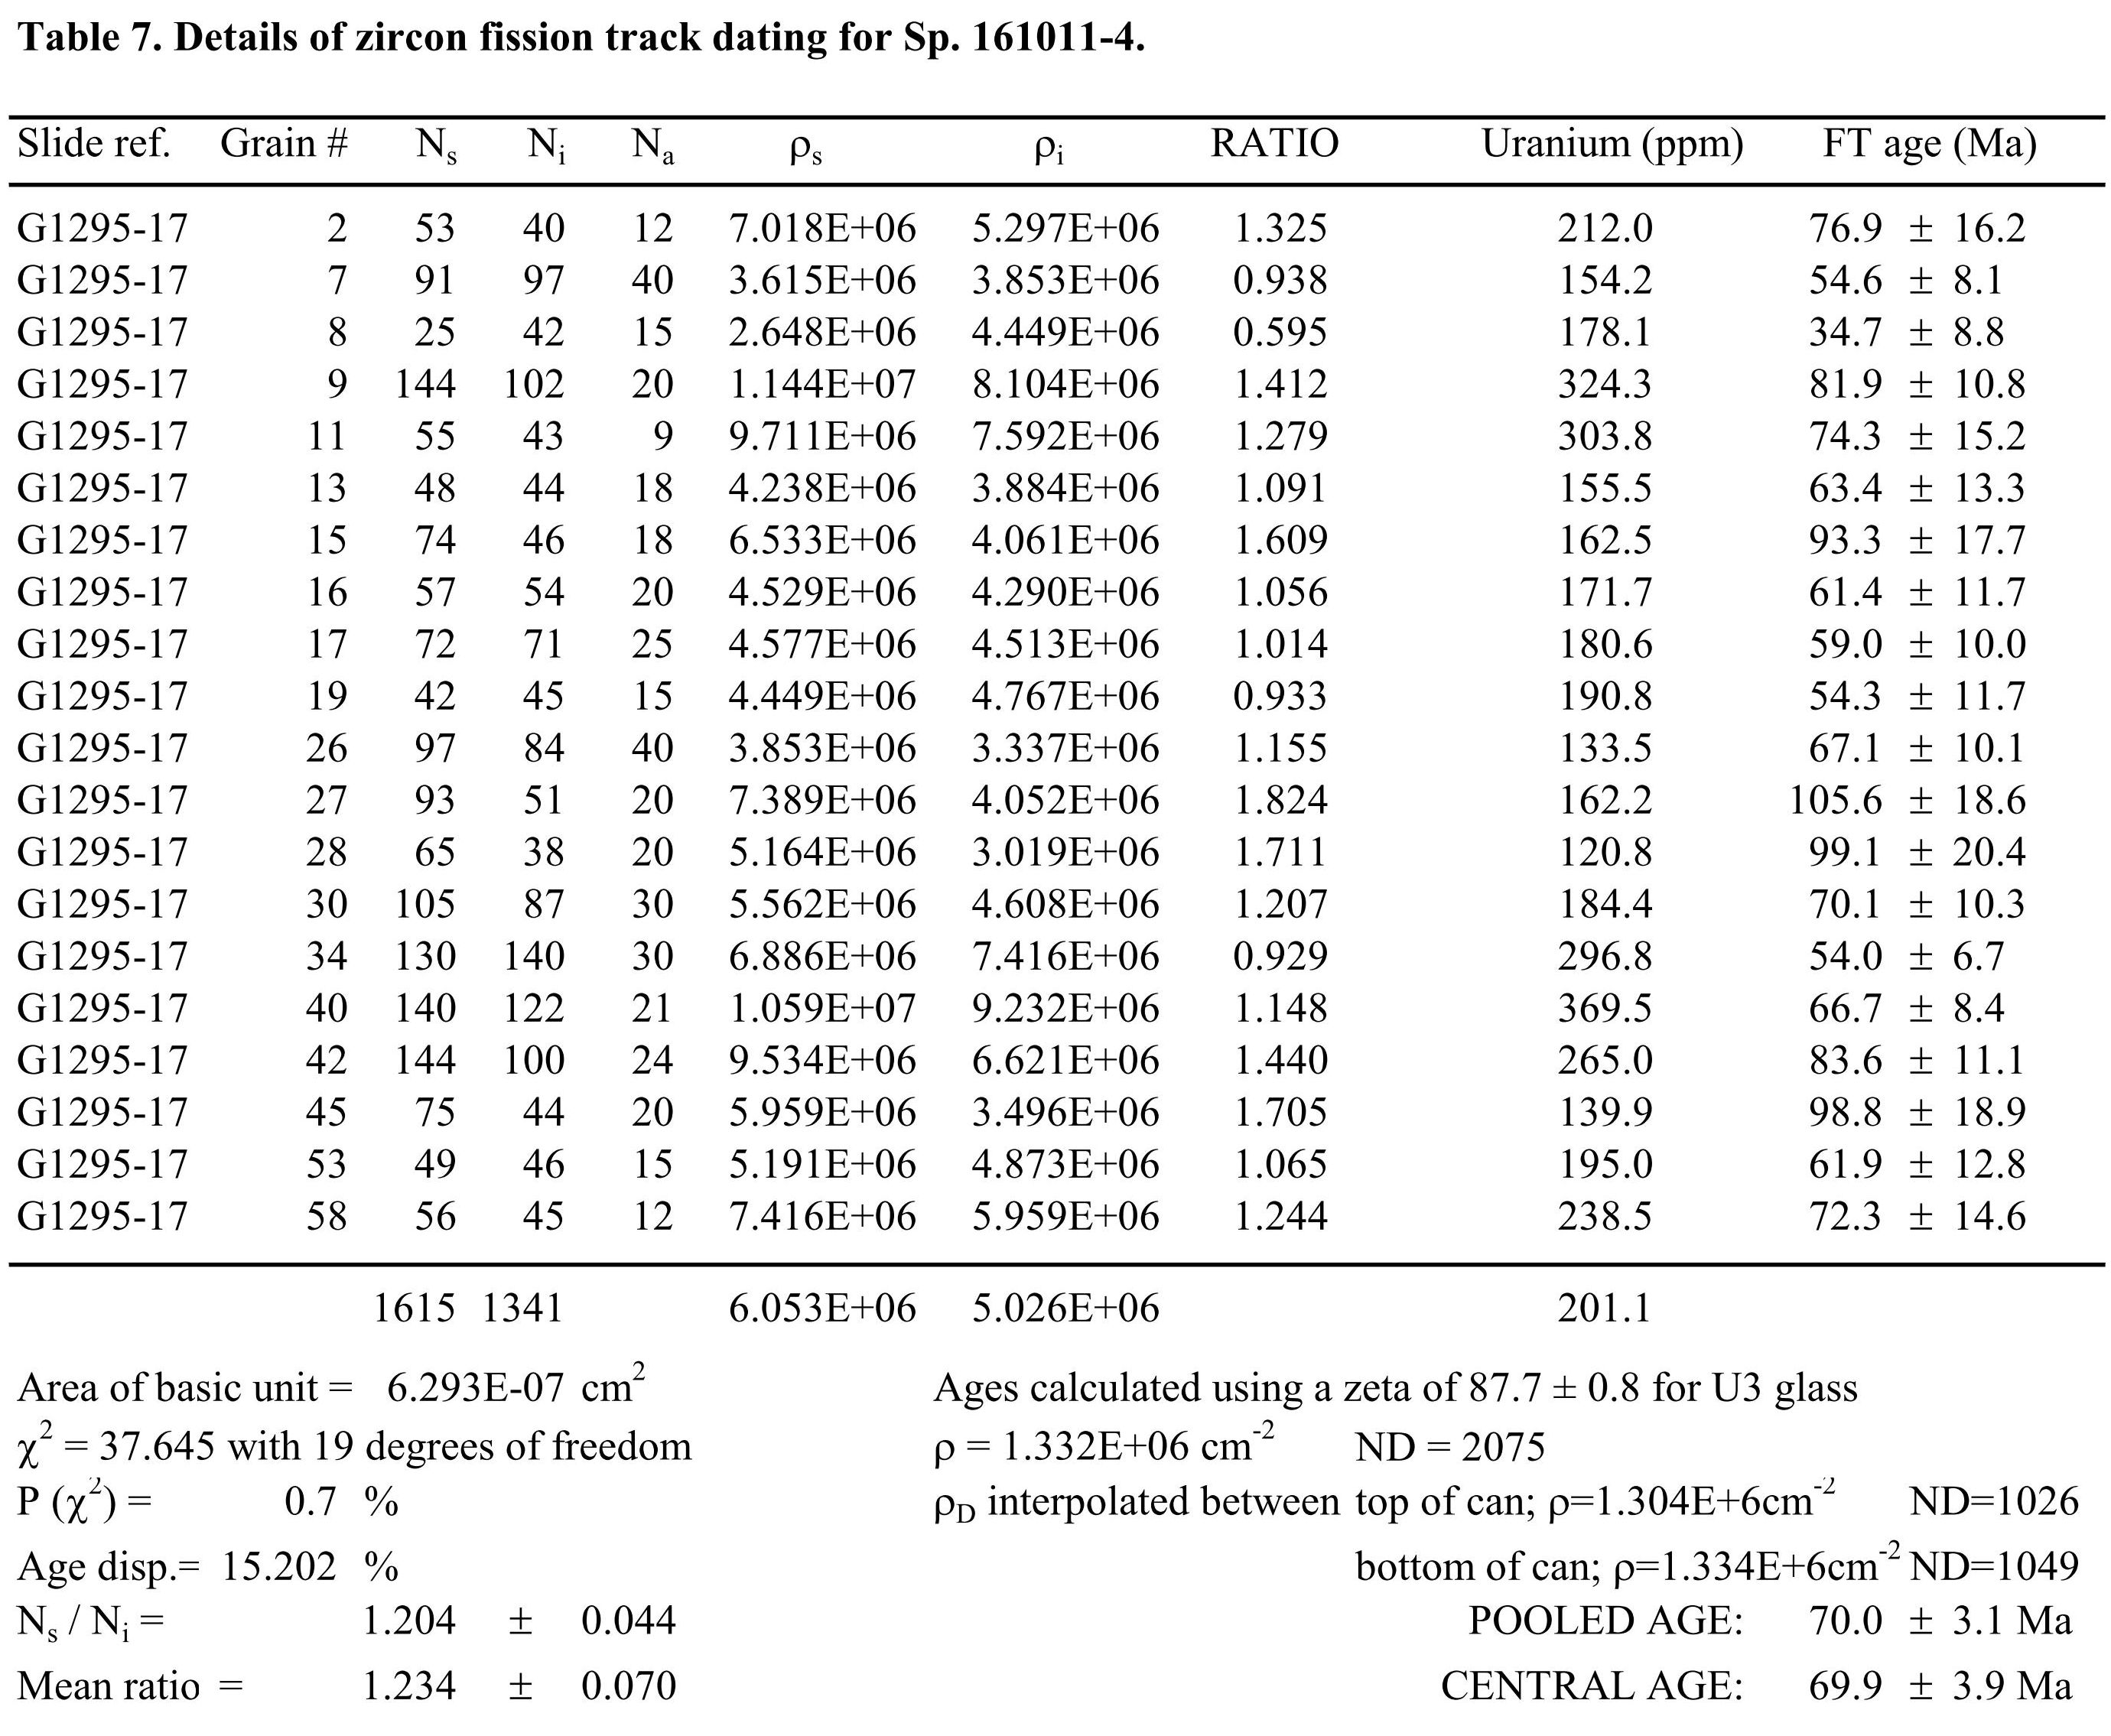
| 主題Scheme | Other | |||||
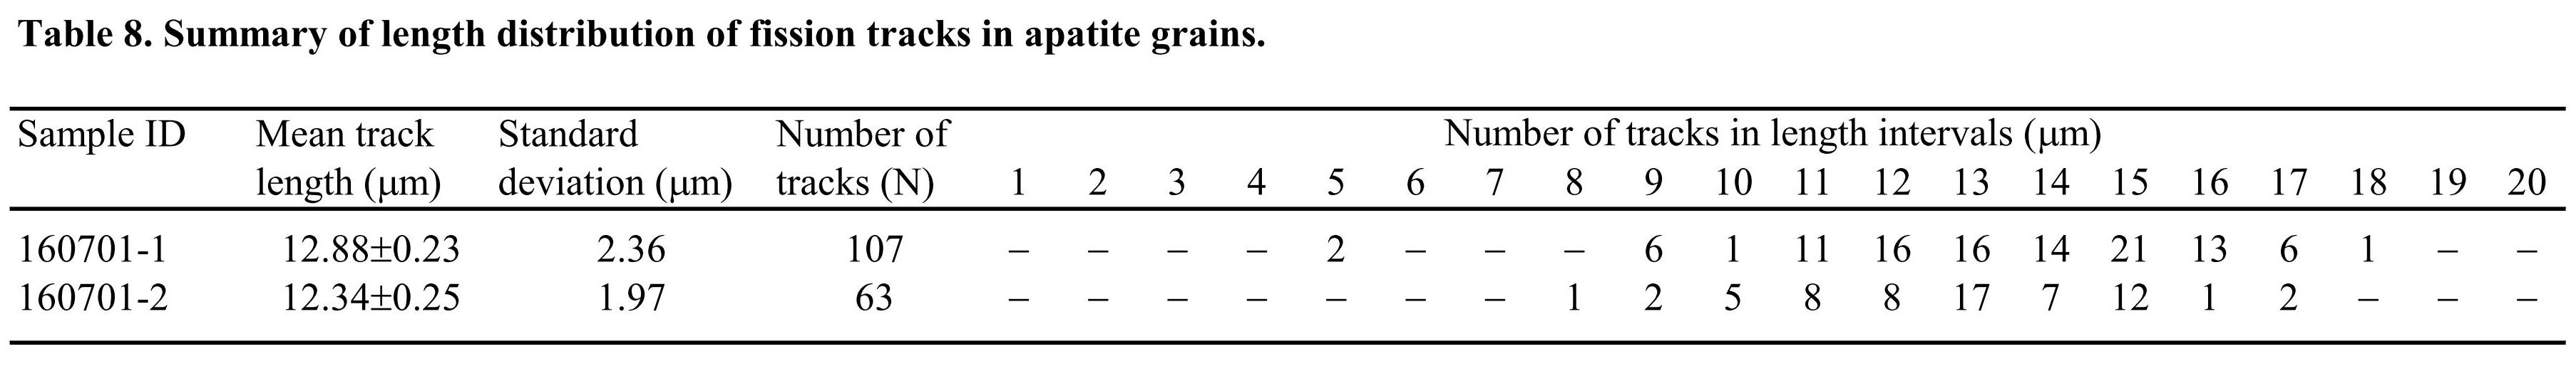
| 主題 | convergent margin | |||||
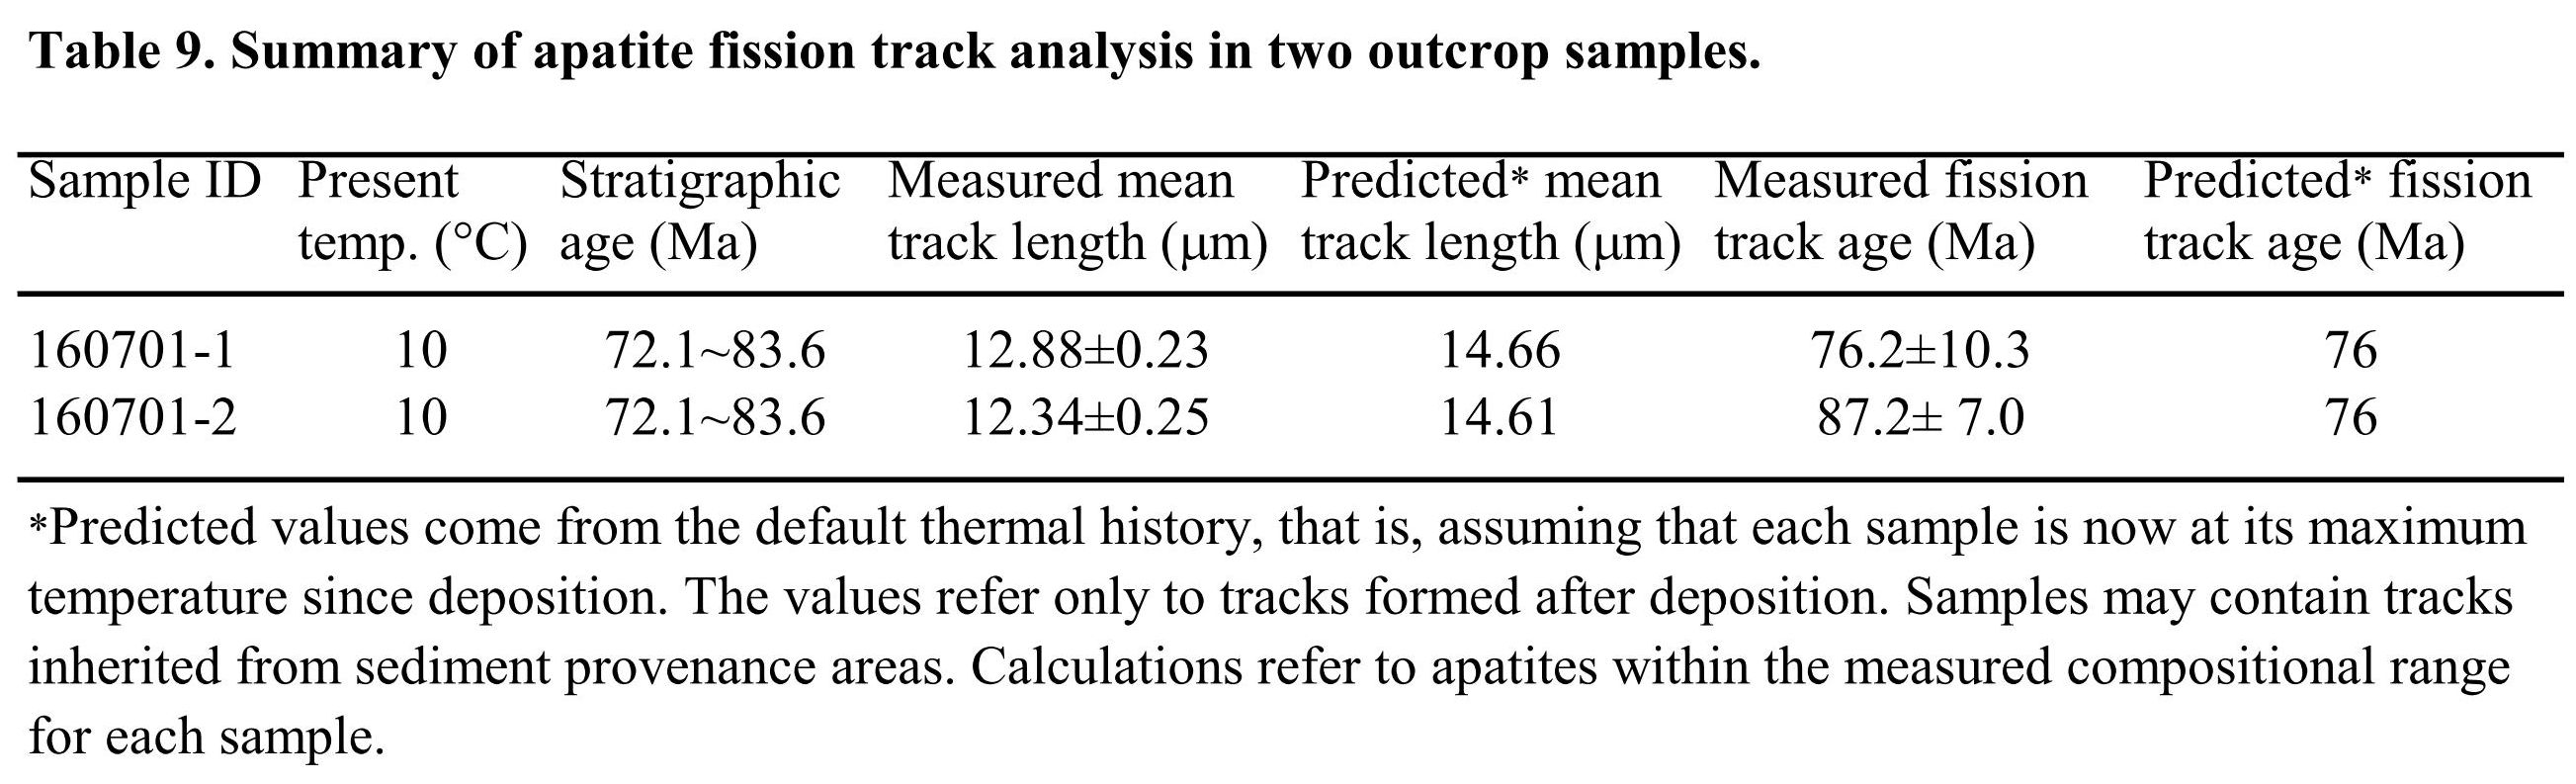
| キーワード | ||||||
| 主題Scheme | Other | |||||
| 主題 | transcurrent fault | |||||
| キーワード | ||||||
| 主題Scheme | Other | |||||
| 主題 | pull-apart basin | |||||
| キーワード | ||||||
| 主題Scheme | Other | |||||
| 主題 | apatite | |||||
| キーワード | ||||||
| 主題Scheme | Other | |||||
| 主題 | fission track | |||||
| キーワード | ||||||
| 主題Scheme | Other | |||||
| 主題 | chemical composition | |||||
| キーワード | ||||||
| 主題Scheme | Other | |||||
| 主題 | thermochronology | |||||
| キーワード | ||||||
| 主題Scheme | Other | |||||
| 主題 | tephrochronology | |||||
| キーワード | ||||||
| 主題Scheme | Other | |||||
| 主題 | Izumi Group | |||||
| キーワード | ||||||
| 主題Scheme | Other | |||||
| 主題 | Cretaceous | |||||
| キーワード | ||||||
| 主題Scheme | Other | |||||
| 主題 | east Asia | |||||
| キーワード | ||||||
| 主題Scheme | Other | |||||
| 主題 | 収束境界 | |||||
| キーワード | ||||||
| 主題Scheme | Other | |||||
| 主題 | 横ずれ断層 | |||||
| キーワード | ||||||
| 主題Scheme | Other | |||||
| 主題 | プルアパート堆積盆 | |||||
| キーワード | ||||||
| 主題Scheme | Other | |||||
| 主題 | アパタイト | |||||
| キーワード | ||||||
| 主題Scheme | Other | |||||
| 主題 | フィッショントラック | |||||
| キーワード | ||||||
| 主題Scheme | Other | |||||
| 主題 | 化学組成 | |||||
| キーワード | ||||||
| 主題Scheme | Other | |||||
| 主題 | 熱年代学 | |||||
| キーワード | ||||||
| 主題Scheme | Other | |||||
| 主題 | テフラ年代学 | |||||
| キーワード | ||||||
| 主題Scheme | Other | |||||
| 主題 | 和泉層群 | |||||
| キーワード | ||||||
| 主題Scheme | Other | |||||
| 主題 | 白亜紀 | |||||
| キーワード | ||||||
| 主題Scheme | Other | |||||
| 主題 | 東アジア | |||||
| 資源タイプ | ||||||
| 資源タイプ識別子 | http://purl.org/coar/resource_type/c_2f33 | |||||
| 資源タイプ | book | |||||
| 著者 |
Itoh, Yasuto
× Itoh, Yasuto× Green, Paul F× Takashima, Reishi× Takemura, Keiji |
|||||
| 著者別名 | ||||||
| 姓名 | 伊藤, 康人 | |||||
| 引用 | ||||||
| 内容記述タイプ | Other | |||||
| 内容記述 | Horizons in Earth Science Research. 17, p.197-224 | |||||
| 書誌情報 |
Horizons in Earth Science Research 巻 17, p. 197-224, 発行日 2017 |
|||||
| フォーマット | ||||||
| 内容記述タイプ | Other | |||||
| 内容記述 | application/pdf | |||||
| 著者版フラグ | ||||||
| 出版タイプ | VoR | |||||
| 出版タイプResource | http://purl.org/coar/version/c_970fb48d4fbd8a85 | |||||
| その他のタイトル | ||||||
| その他のタイトル | アパタイトのフィッショントラック解析及び微量元素組成に基づく東アジア収束境界の白亜紀イベント堆積シーケンスの熱史・テフラ年代学的研究 | |||||
| 出版者 | ||||||
| 出版者 | Nova Science Publishers, Inc. | |||||
| 資源タイプ | ||||||
| 内容記述タイプ | Other | |||||
| 内容記述 | Book chapter | |||||

)
)
)
)
)
)
)
)
)
)
)
)
)
)
)
)